Data for the proportion of adults working in Minnesota were recently released. Compass researcher Jane Tigan provides some insight into what these numbers tell us.
Q. Minnesota Compass tracks the proportion of adults working to gauge how our workforce is faring. Why not the unemployment rate?
A. The easy answer is that our advisors recommended it. All key measures featured on Minnesota Compass are selected by multi-sector advisory groups that we convene to help identify the most meaningful indicators for our state, and they thought Proportion of Adults Working looked more fully at the employment picture.
But, it’s important to understand what goes into both measures when thinking about employment and trends. The unemployment rate looks at the number of people who are working (full or part-time) and the number of people who are in the labor force. To be considered in the labor force, a person must have “actively” looked for a job in the past four weeks. That leaves out discouraged workers who haven’t looked for a job that recently. As the result of the recent economic downturn, we have had a fair number of discouraged workers. On the other hand, the proportion of adults working measure on Minnesota Compass takes into account all of the U.S. civilian, non-institutionalized, adult population who are jobless, including discouraged workers. It also includes people who choose not to work, e.g., stay-at home parents or students, in the total number of adults.
Q. We’ve heard mixed reviews of how much the economy is improving and what it means for job growth. Do these numbers add clarity?
A: Overall, we can say we’re doing better than we were three years ago. Between 2008 and 2011, Minnesota’s proportion of adults working declined then stagnated, but in 2012 we saw a statistically significant increase in the share of people working to 76 percent, up from 74.6 percent in 2008. This closely mirrors the U.S. as a whole and aligns with Minnesota’s job growth. And, when we look a little bit deeper at the data, we see that how you’re doing really depends on who you are.
Q: What do you mean by how you are doing depends on who you are?
A. Well, the Twin Cities ranks #1 among the top 25 metros for the share of its 16-64 year olds who are working and Minnesota is # 3 among states overall. But the metro is also #25, #24, and # 23 when looking at specific groups. The state and metro have a very mixed record for the employment outcomes depending on race, ethnicity, and nativity.
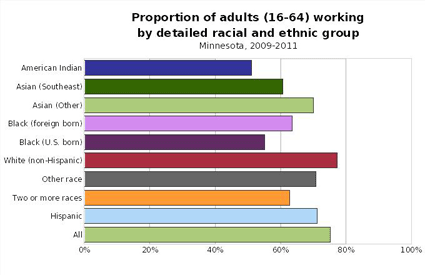
Here’s where we’re doing relatively well: Minnesota's figures for the proportion of white (non-Hispanic) adults working are among the nation’s highest. This is also true for Minnesota's Hispanic adults, both statewide and the metro area. We also see the gap between the proportion of white (non-Hispanic adults) and immigrants working has narrowed since 2000, although there are wide differences by birthplace and gender.
But beyond that, it is fair to say there is a lot of room for improvement. For example, in Minnesota, the proportion of American Indians, U.S.-born Blacks, and Southeast Asians working is considerably lower than the overall 76 percent number.

It’s not just that we have mixed outcomes among racial groups within the state; it’s that most other states and metros have better outcomes than we do for employment of adults of color especially when compared to white (non-Hispanic) adults. In fact, in 6 of the 8 racial and ethnic groups that we track, the state’s employment gap is among the bottom 5 states. Among the top 25 largest metros, we rank near or at the bottom in employment gaps for nearly every race group except Hispanic adults.
Q: What about the younger workforce?
A: Well, it’s important to note that the figures for the youngest (16-19) are always the lowest, which is of little surprise since about half of teenagers aren’t in the labor force at all. That being said, over the past decade we see that the youngest age groups have experienced the most dramatic shifts in the share who are working.
Since 2000, the share working has declined 13 percentage points, more than any other age group. What’s more, their recovery from the Great Recession is more stalled than all others—the share is still 5 percent lower than it was in 2008. While some of the unemployed in these age groups may be non-working students, it is unlikely that accounts for the entire decline (after all, many students do work through highschool and college). Unfortunately, the next youngest age group (ages 20-24) hasn’t seen much of a recovery, either. Together, 16-24 year-olds have seen a 4 percentage-point decline in the proportion of adults working since 2008. These younger workers have been less able to secure jobs through the recession. Many analysts (such as the Brookings Institution and Economic Policy Institute), have noted that this may have long-term impacts.
Jane Tigan is a former researcher on the Compass project.