

In the types of data sources we use on Compass, information about Black Minnesotans often includes anyone who self-identifies as Black or African American. These data can include a wide range of ancestries, birthplaces, and cultural identities. When unique cultural groups are grouped together under one common category like “Black Minnesotans,” we can’t always identify and understand quality of life across distinct cultural groups. Therefore, this article highlights the importance of data disaggregation in understanding the varying lived experiences of Black Minnesotans.
Minnesota’s Black community is made up of many unique cultural communities.
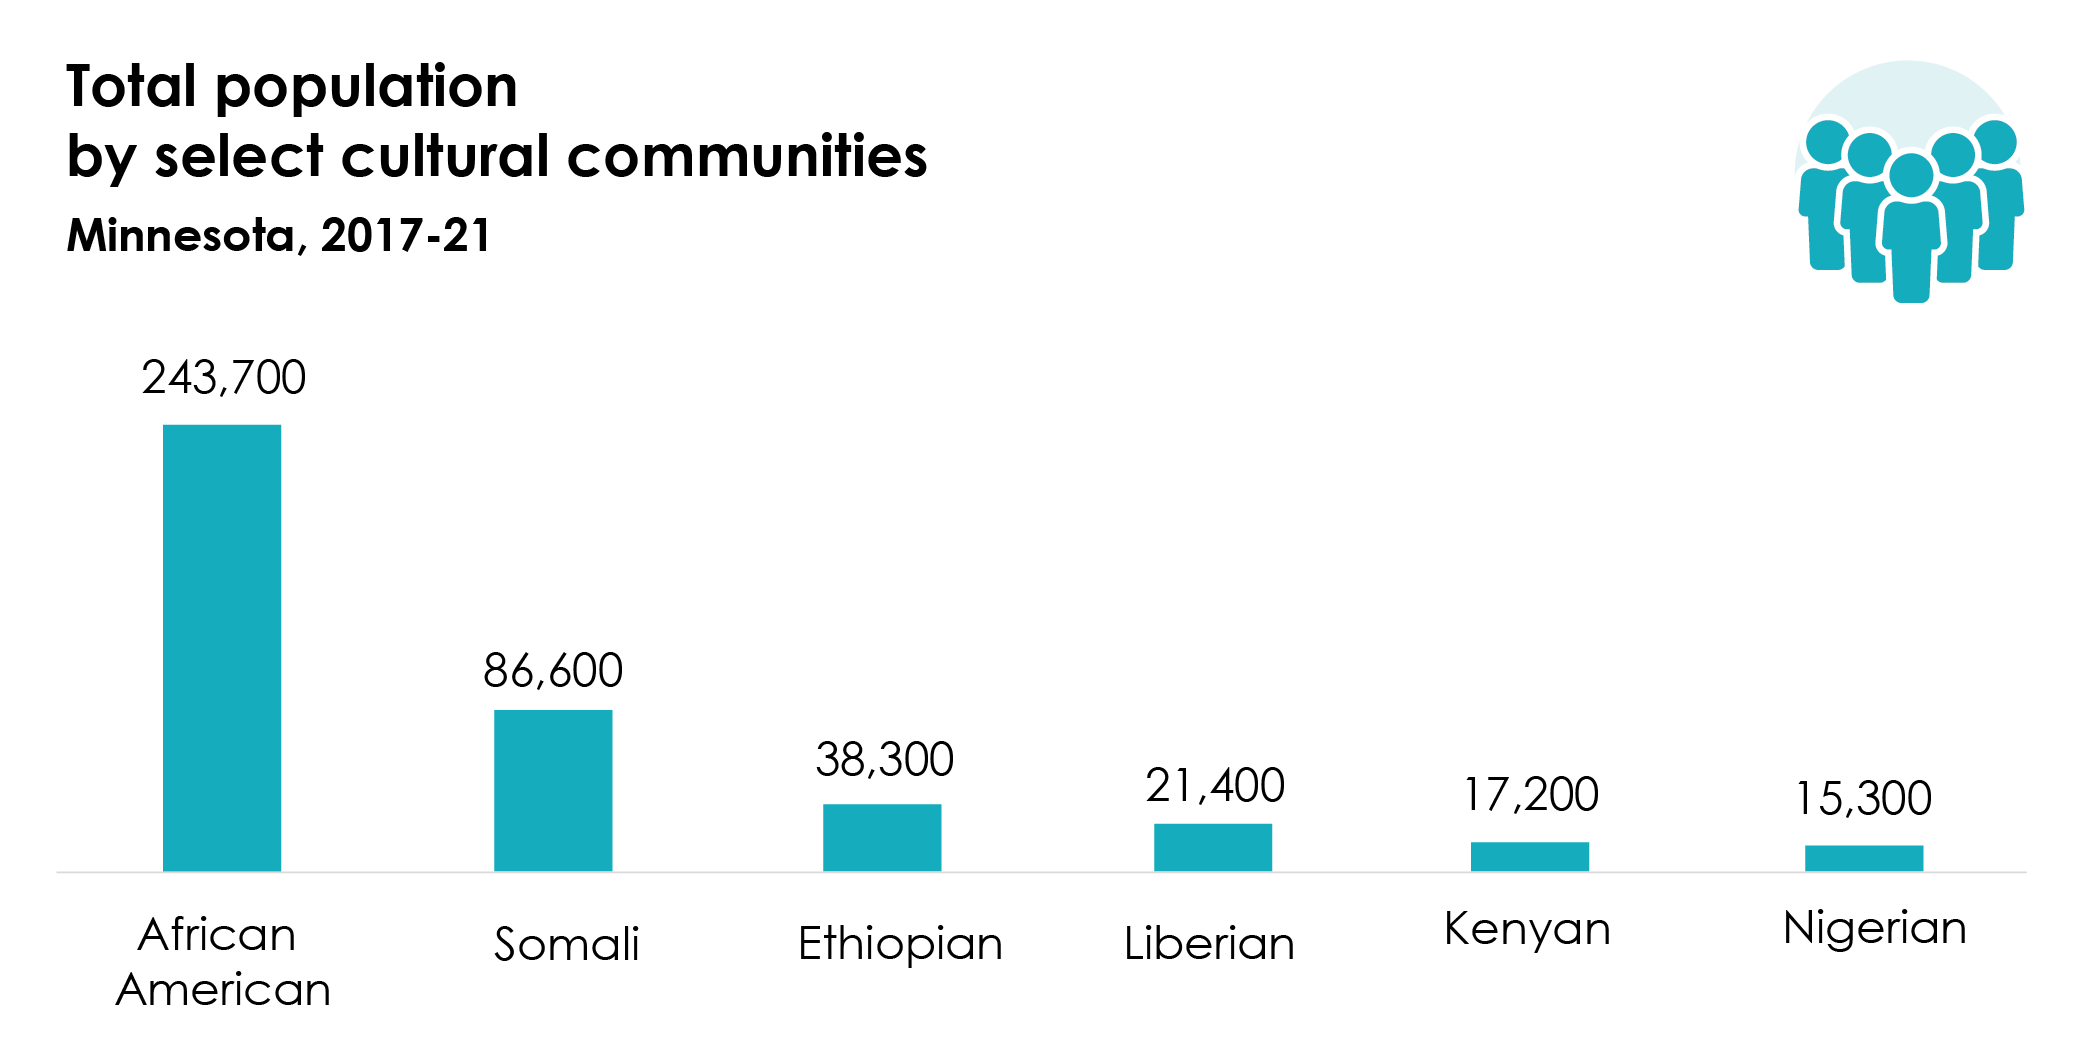
Minnesota is home to more than 430,000 Black residents, or nearly 8% of our total population. But this broad, census-level category doesn’t give us a complex, nuanced understanding of Black Minnesotans. This is especially true in our state, where East African immigrants from Ethiopia, Kenya, and Somalia and their U.S.-born children make up a large share of the Black population.
Experiences, strengths, challenges, and needs vary by community, which is why disaggregating populations beyond broad census-level race groups is so important.
Somali Minnesotans face acute economic challenges.
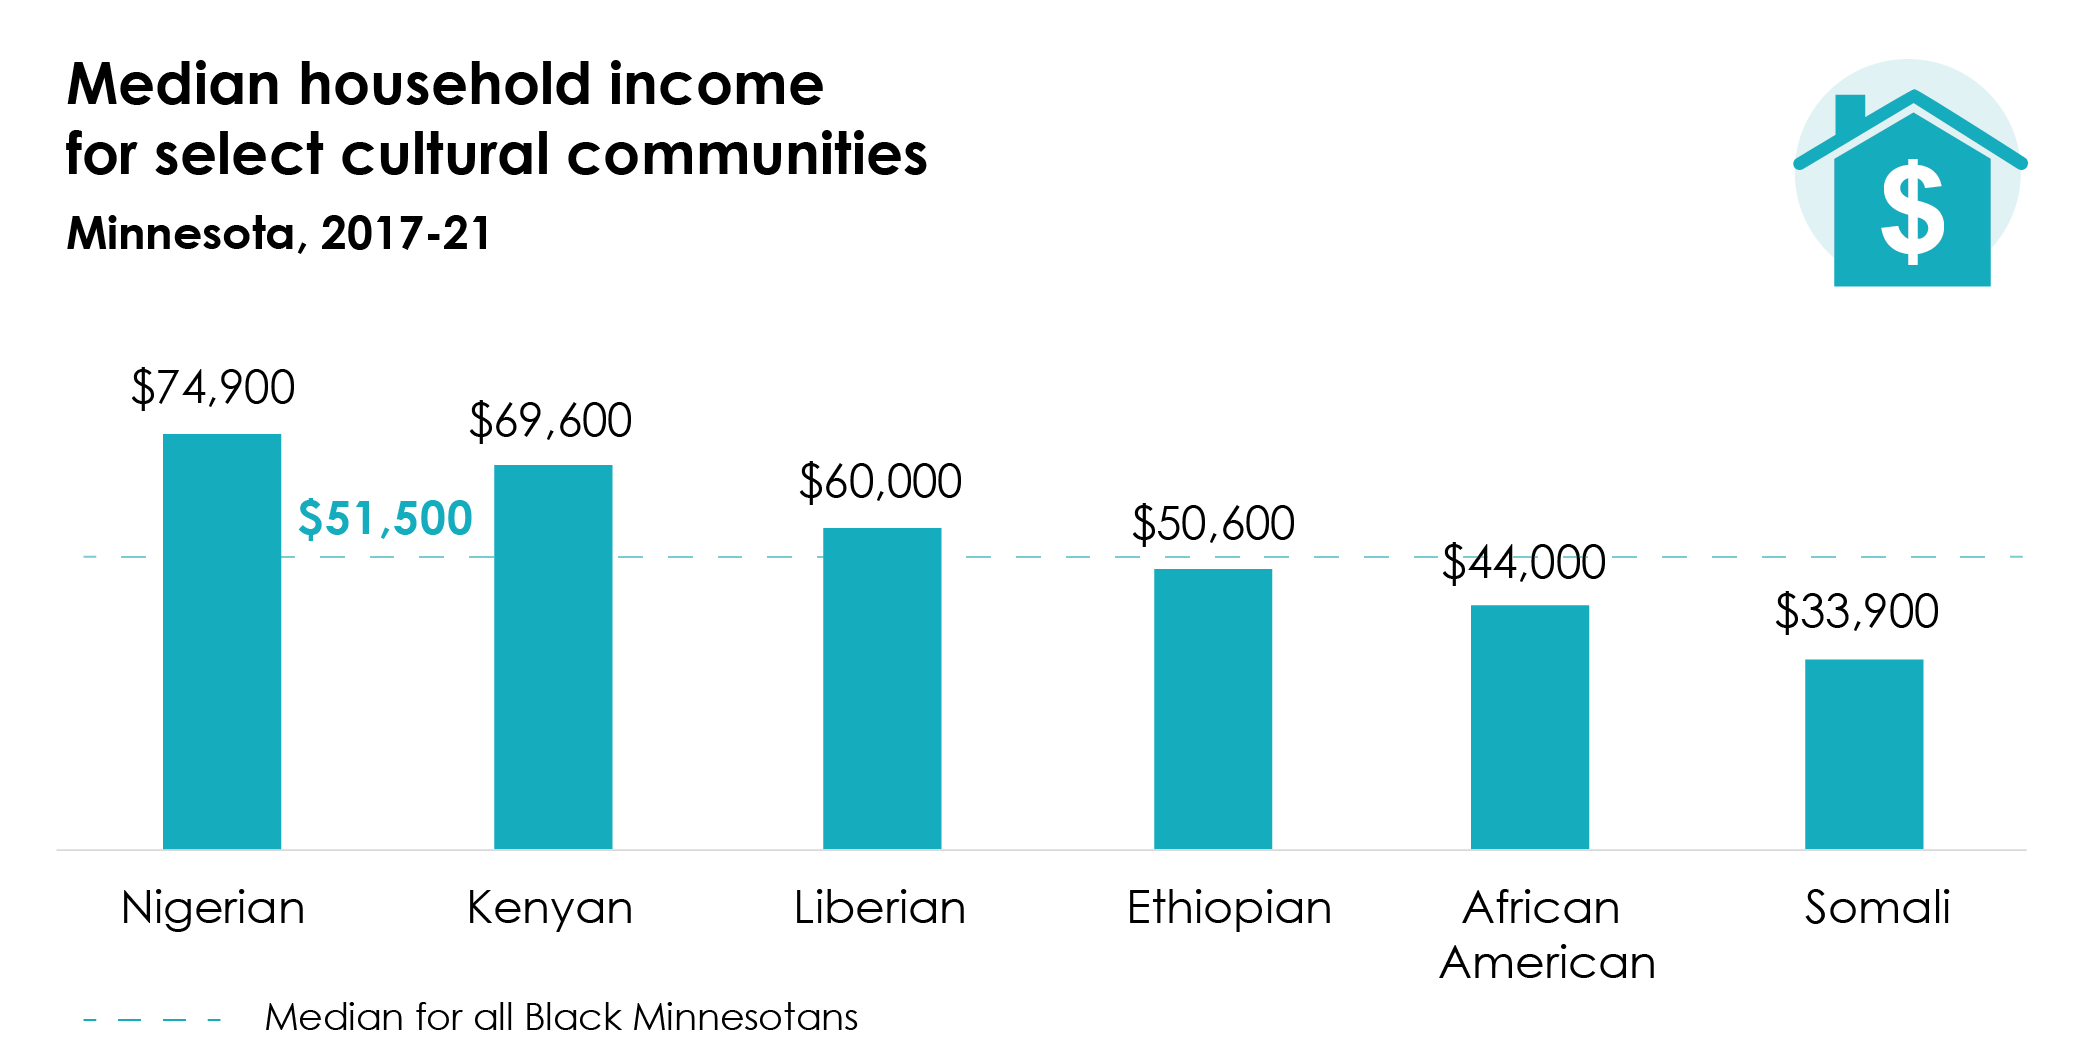
Median household income among Black-headed households is $51,500, but this varies widely across select cultural communities. Kenyan- and Nigerian-headed households have incomes that are at least $18,000 higher than the overall average for Black-headed households, while Somali-headed households’ median household income falls $18,000 below the average.
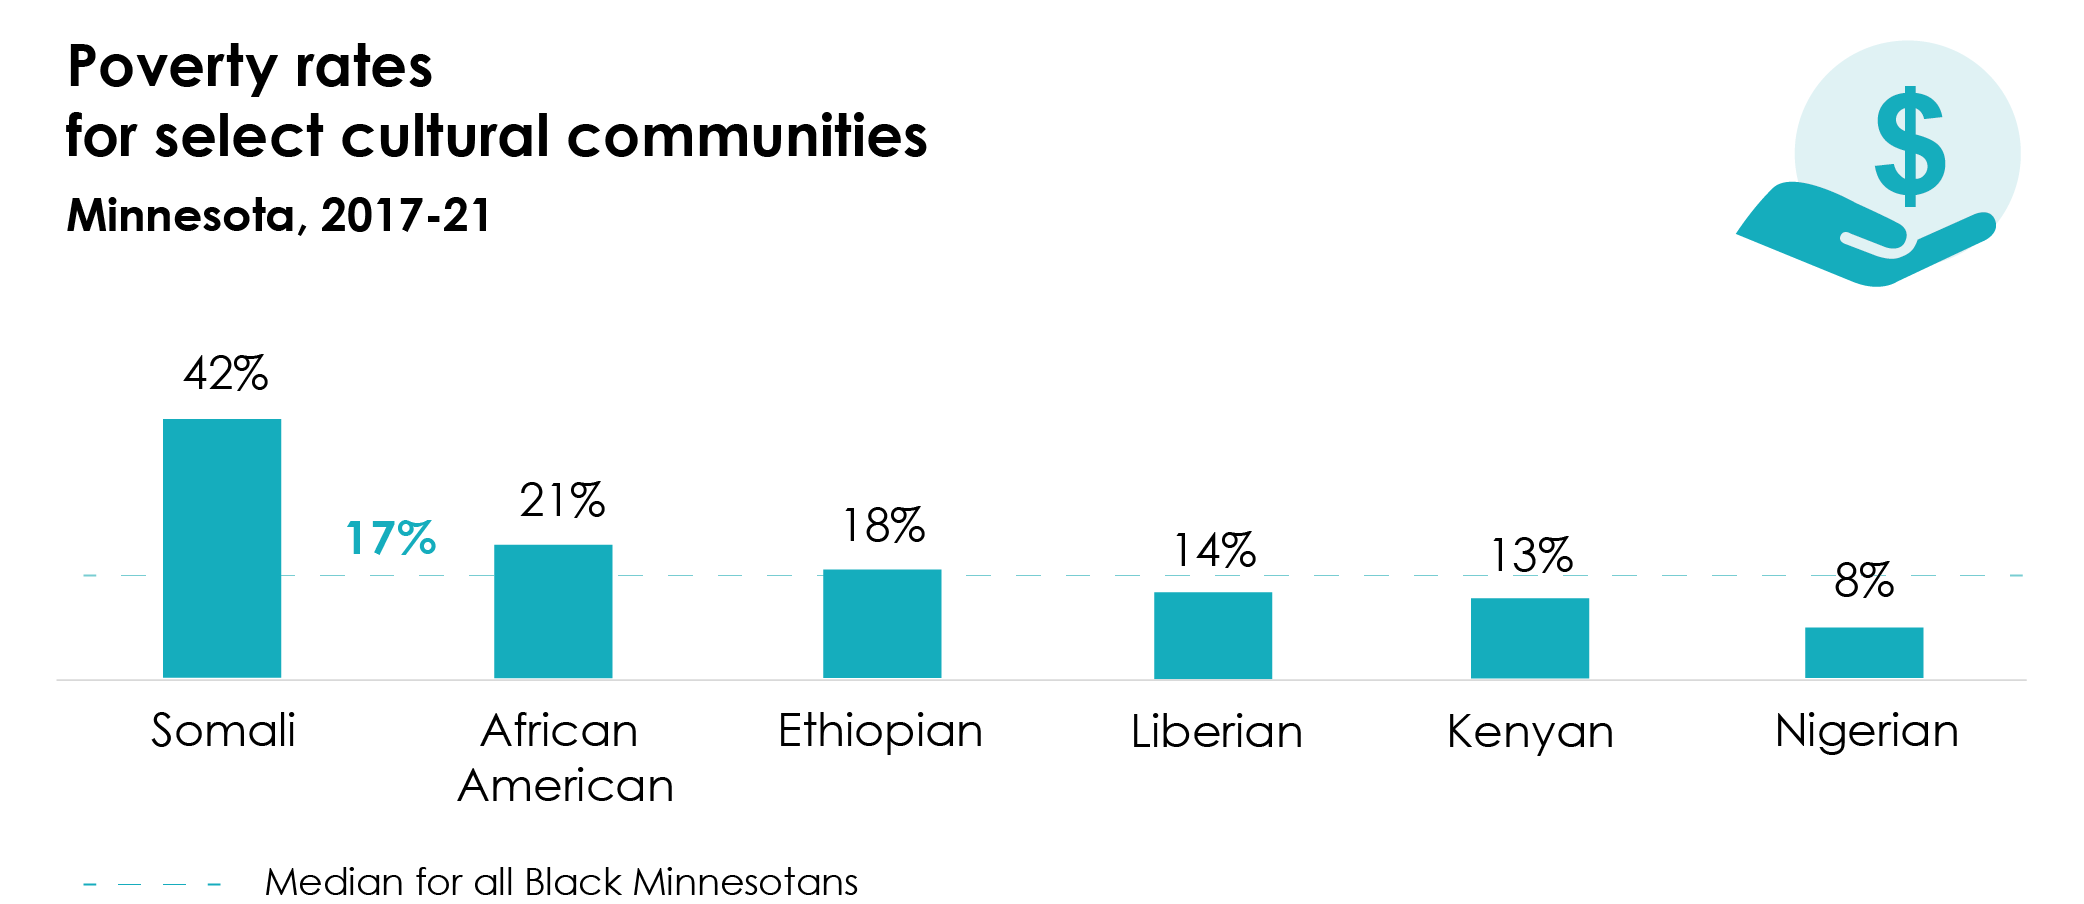
Somali Minnesotans also have poverty rates that are 25 percentage points higher than the Black poverty rate overall.
Somali Minnesotans also face acute housing challenges.
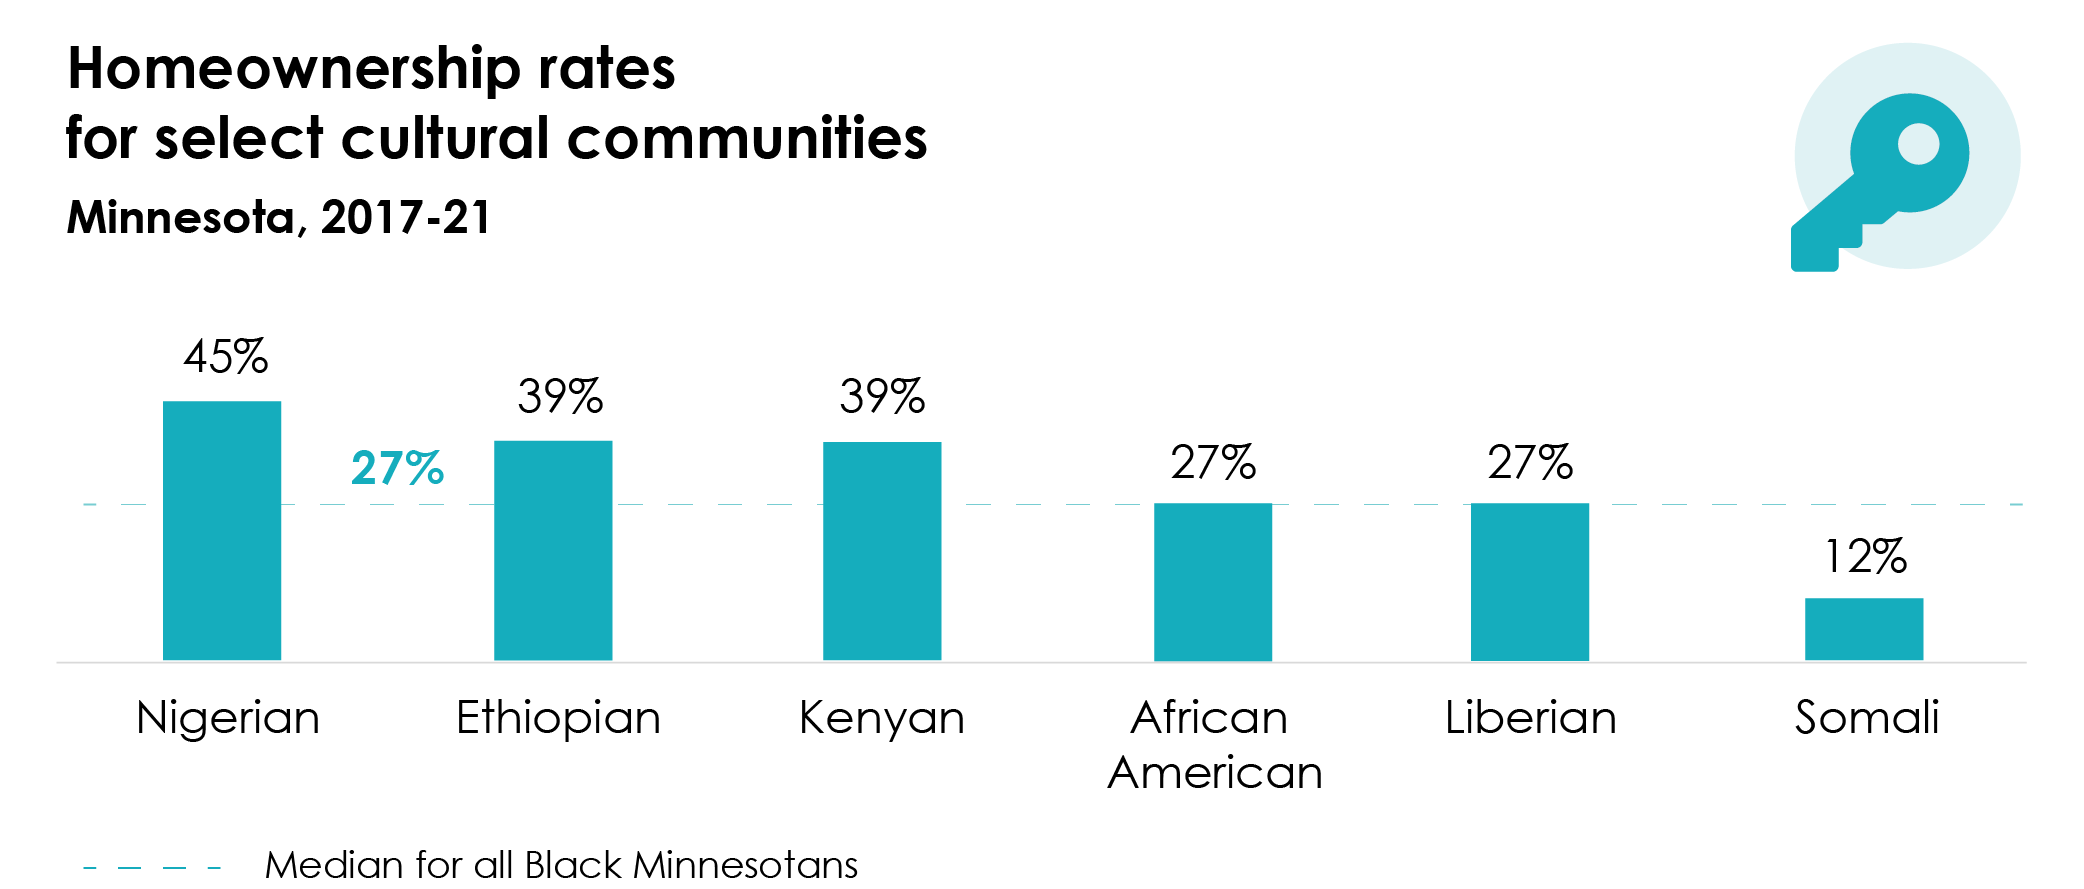
Twenty-seven percent of Black-headed households own their home, but this ranges from 12% of Somali-headed households to 45% of Nigerian-headed households. For many families, homeownership requires taking on debt (i.e., a mortgage) to pay for their home. It is important to note, therefore, that unique cultural practices, norms, and values around debt may influence the trends we see in the data.
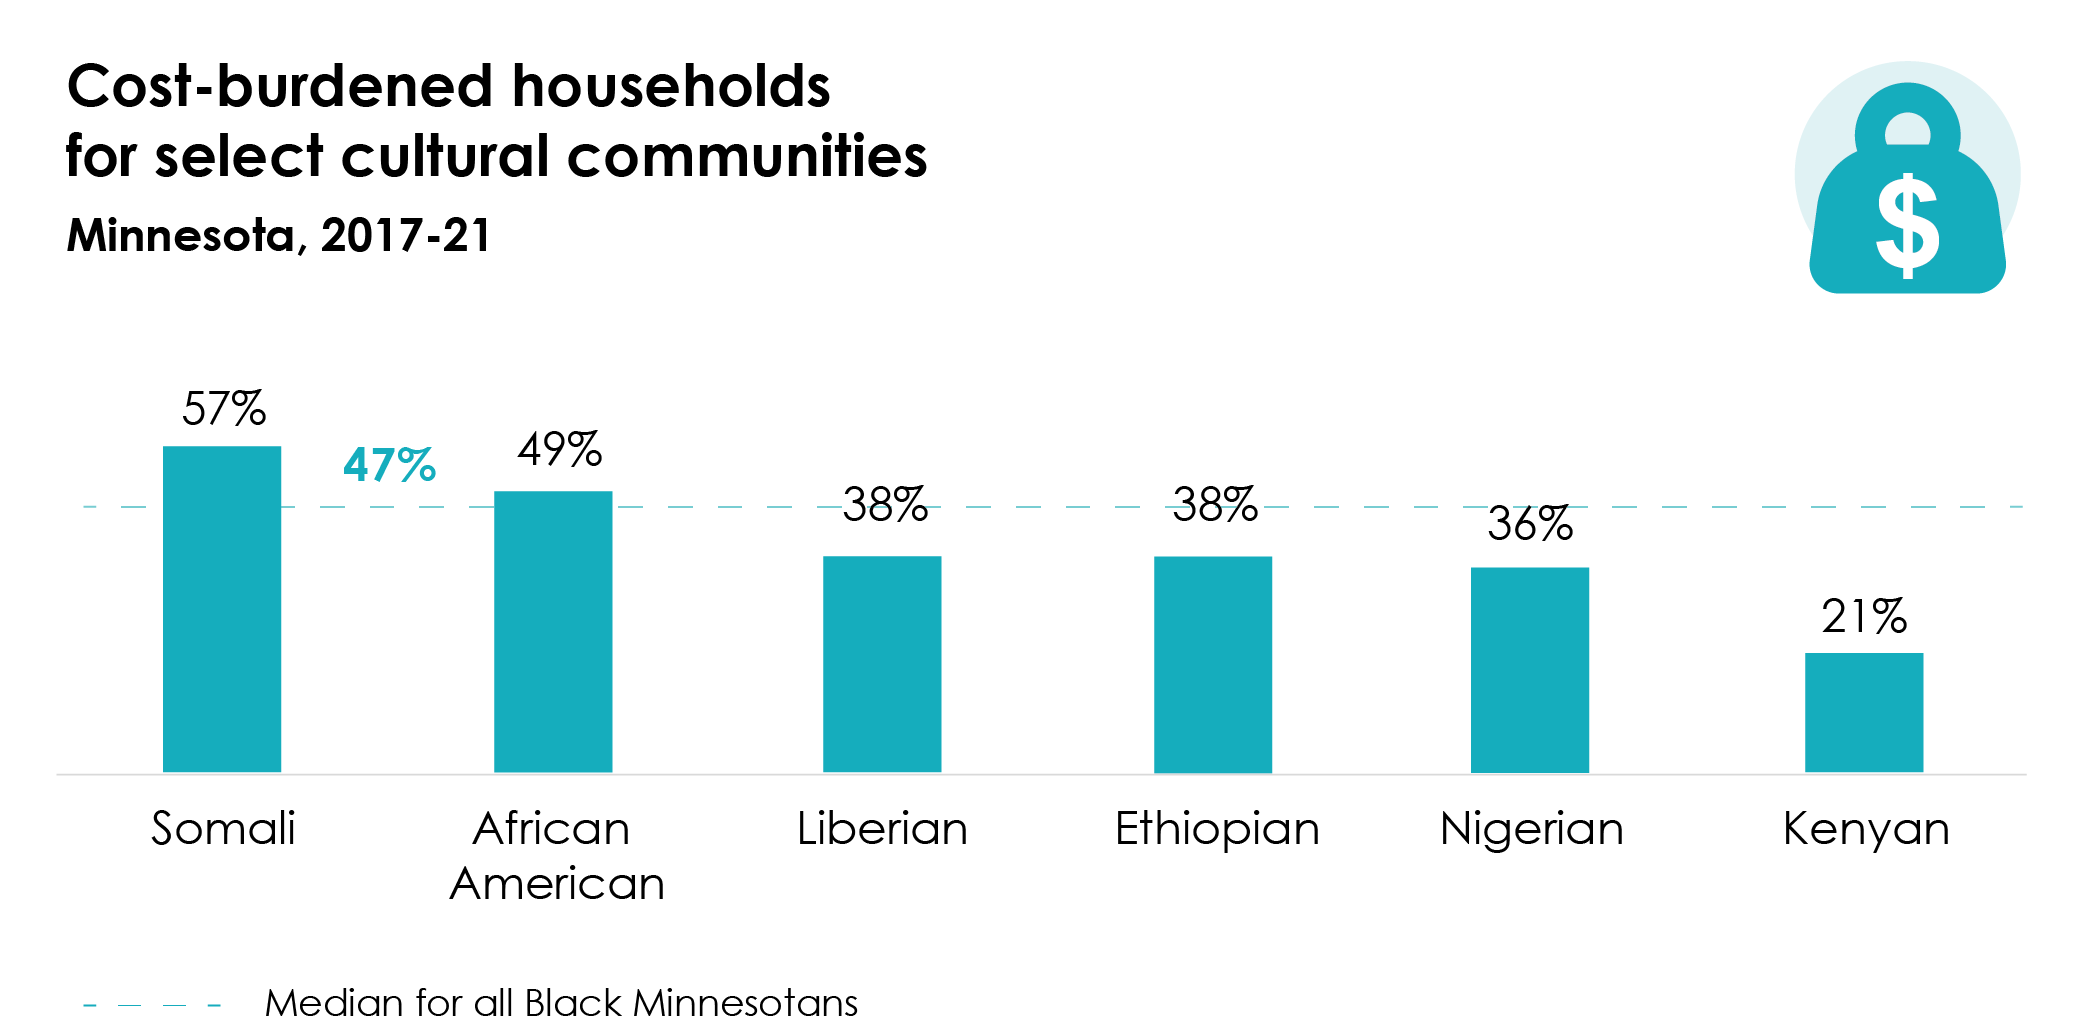
Compared to all Black-headed households, greater shares of African American and Somali-headed households pay too much for housing. “Housing cost burden” is defined as paying 30% or more of household income for housing. Well over half of Somali-headed households are housing cost-burdened, compared to 47% of all Black-headed households in Minnesota.
Cultural community and sex matter to understanding employment.
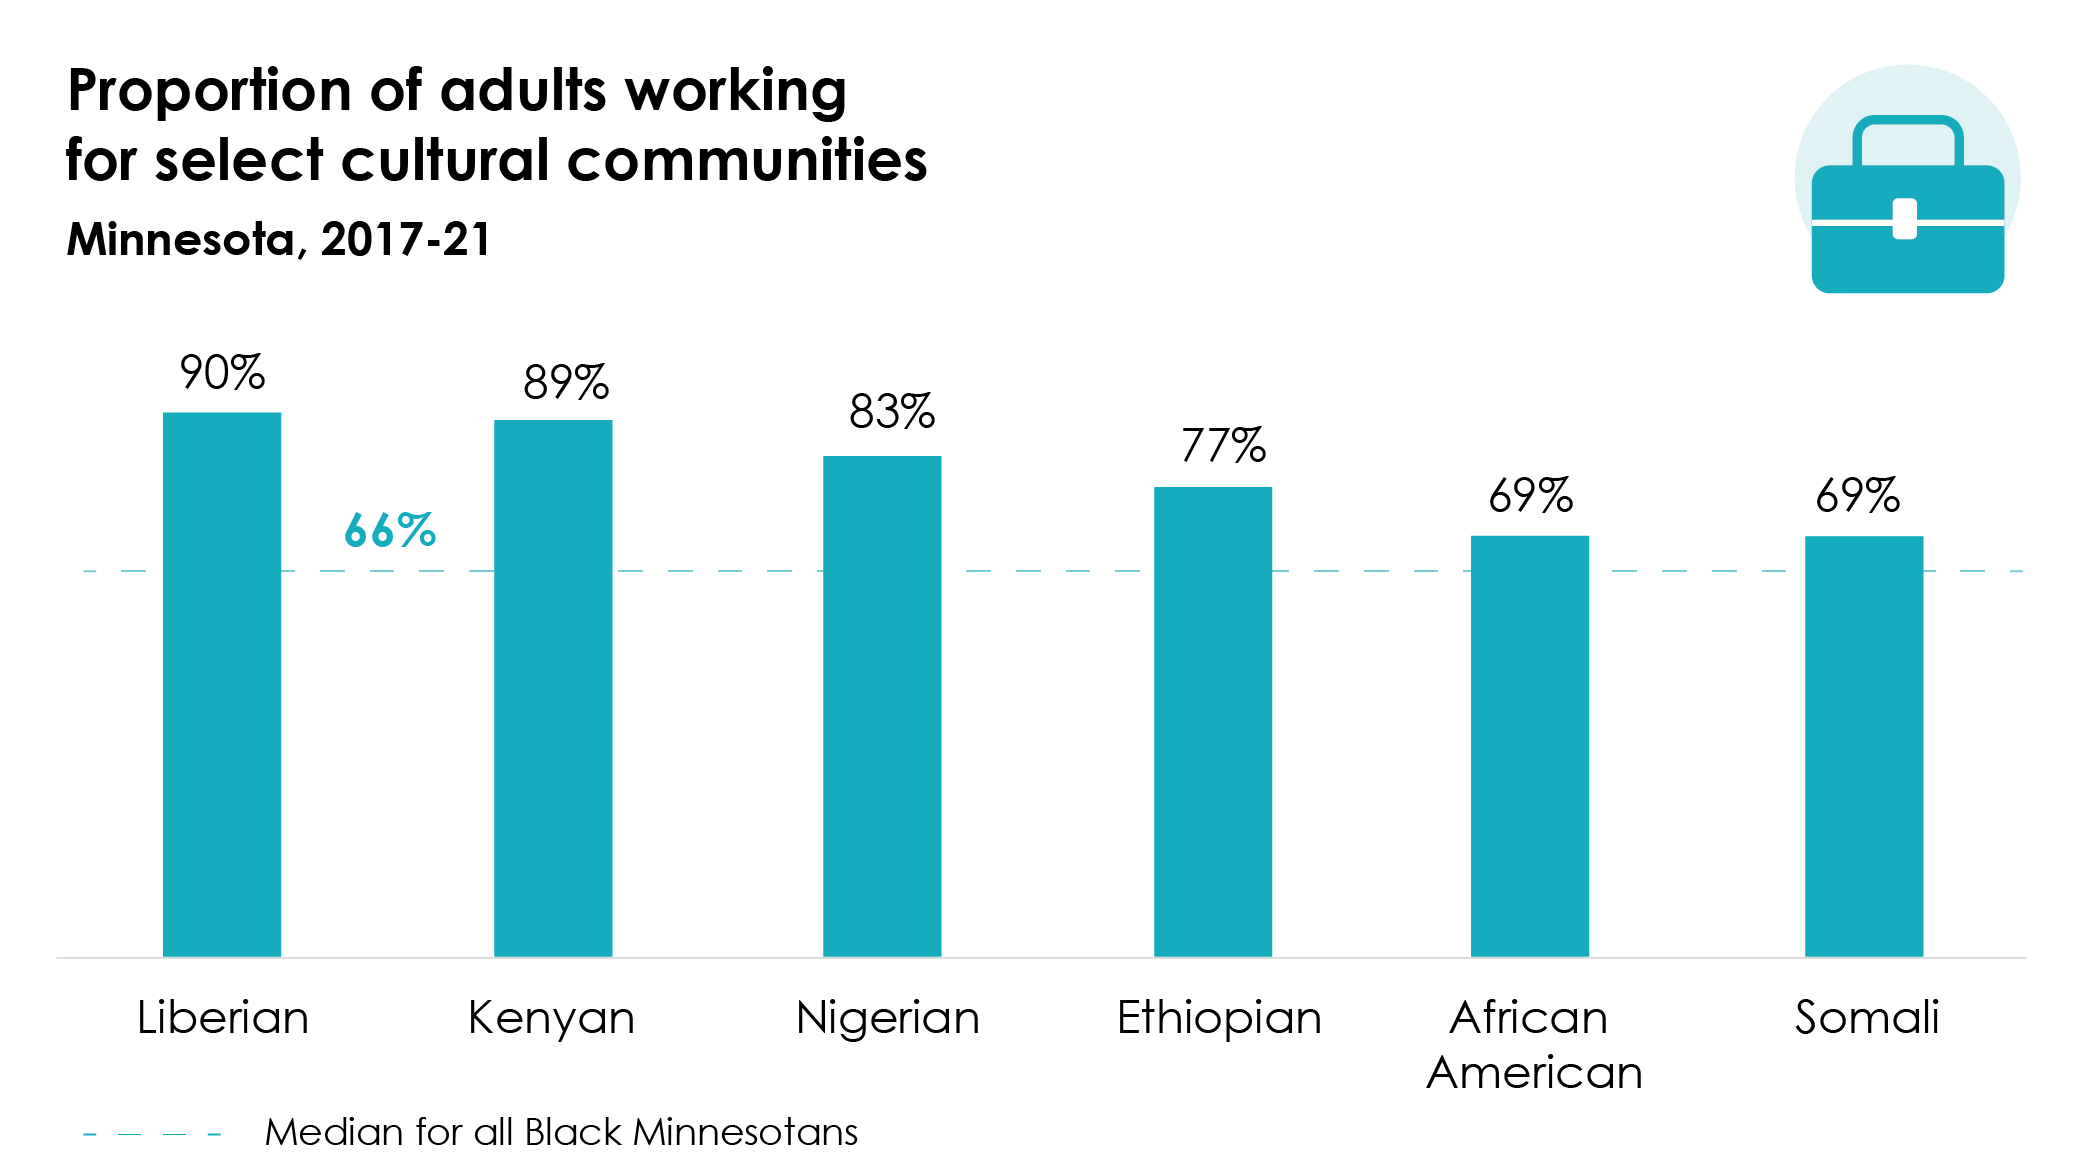
While 66% of Black Minnesotans are working, proportions of adults working are 10 to 20 percentage points higher among Ethiopian, Kenyan, Liberian, and Nigerian adults.
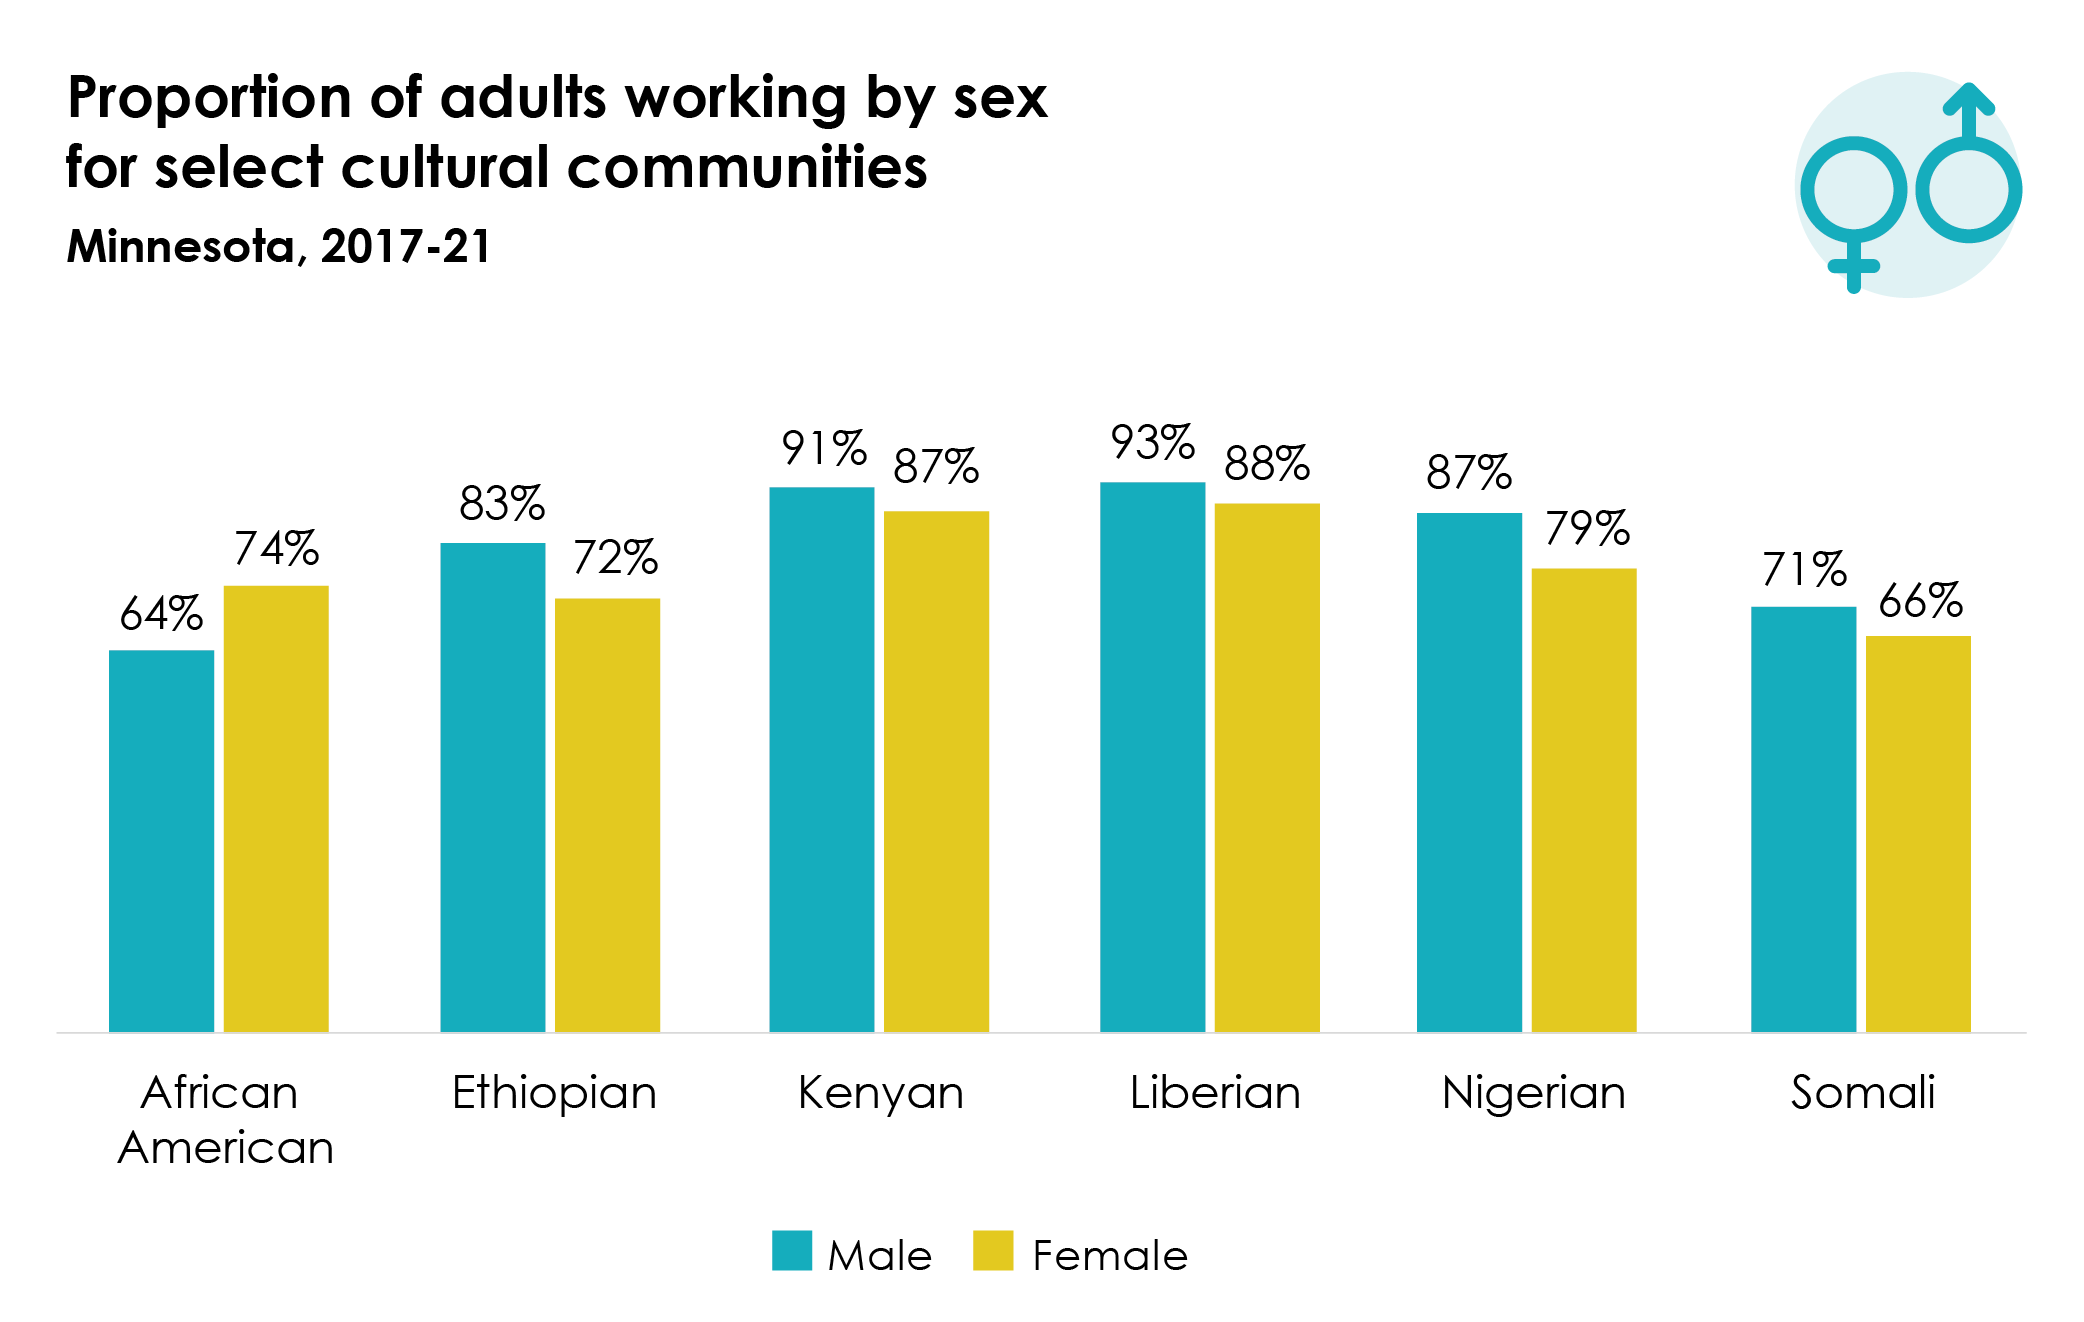
This is the only cultural community in which we see a greater share of women working than men. Within all other cultural communities shown below, similar shares of men and women are working.
This further underscores the importance of data disaggregation to understanding the varying lived experiences of Black Minnesotans across dimensions of culture and sex.
One more time: Minnesota’s Black community is made up of many unique cultural communities.
The stories we tell about Black Minnesotans require us to consider more than broad census-based categories. Based on the data above, you can see that data disaggregation is important to understanding the stories we need or want to tell about Black Minnesotans. But identities are social constructs and these data represent cultural communities that cannot be fully captured with the variables available in our data sources.
And no one data source—on its own—can tell the full story. Data disaggregation is a step in the right direction and we have pulled together multiple self-reported characteristics—ancestry, ethnic group, birthplace, parents’ characteristics—to provide a more nuanced understanding of unique cultural communities. But we are talking about complex social issues that not only require information from multiple sources, but also rely on community wisdom to make meaning and identify necessary actions.
Additional resources
More about data disaggregation
The Office of Management and Budget (OMB) sets the minimum race categories—American Indian or Alaska Native, Asian, Black or African American, Native Hawaiian or Other Pacific Islander, and White—for all federal agencies, including the U.S. Census Bureau. So any additional categories must roll up to those five groups. OMB defines Black as “A person having origins in any of the Black racial groups of Africa.” Because this category combines all people who have ancestry coming from Africa, whether they identify as African American or Black African, it is important to disaggregate data further to better understand unique experiences of our various communities. Census responders are able to self-identify themselves when filling out forms, and are able to self-describe their origins. For example, under the Black or African American check box, responders are also presented with instructions to print origins such as African American, Jamaican, Haitian, Nigerian, Ethiopian, Somali, etc.