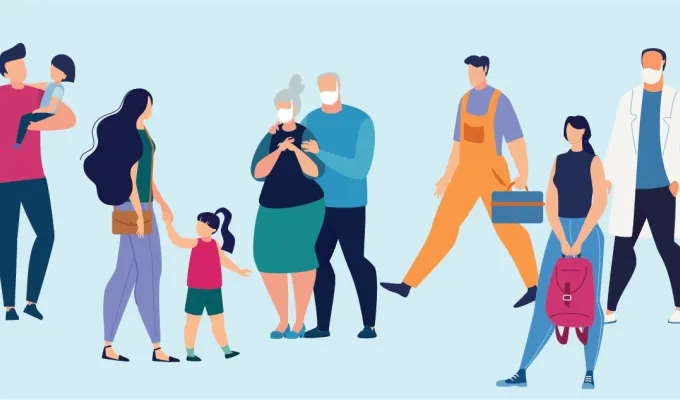
The U.S. Census Bureau's standard racial and ethnic categories often fall short of reflecting how communities define themselves, and don't reflect the composition and quality of life of diverse Minnesotans throughout the state. We developed data profiles for the largest cultural communities in Minnesota, including African American, Chinese, Ethiopian, Filipino, Hmong, Indian, Korean, Mexican, Native American, Somali, Vietnamese, and more, based on a combination of self-reported race, ancestry, birthplace, and parental characteristics. We provide data on cultural communities to better reflect, understand and support these communities, and their specific strengths and needs.
Fast facts
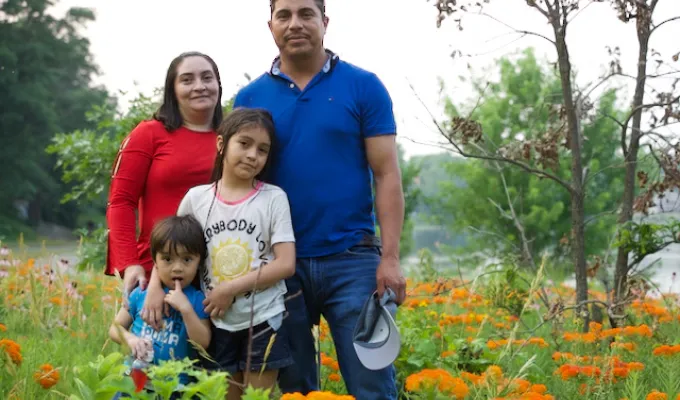
Nearly 4 in 10 Mexican Minnesotans live outside of the Twin Cities
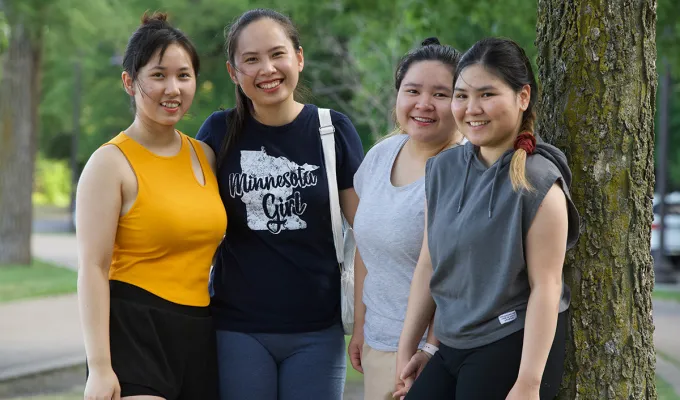
More than 9 in 10 Hmong Minnesotans live in the Twin Cities
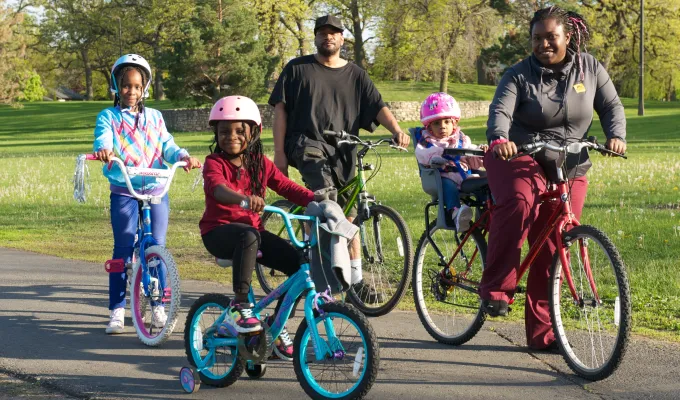
Nearly 9 in 10 Somali-headed households live in rental housing
| Cultural community Sort descending | Population |
|---|---|
| African American | 266,996 |
| Burmese | 17,123 |
| Cambodian | 11,984 |
| Chinese | 41,717 |
| Colombian | 9,431 |
| Cuban | 9,406 |
| Ecuadorian | 18,271 |
| Ethiopian | 40,324 |
| Filipino | 25,203 |
| Guatemalan | 17,172 |
| Hmong | 99,912 |
| Indian | 51,909 |
| Japanese | 13,391 |
| Kenyan | 20,967 |
| Korean | 27,204 |
| Lao (non-Hmong) | 15,191 |
| Lebanese | 6,959 |
| Liberian | 20,720 |
| Mexican | 229,576 |
| Minnesota | 5,713,716 |
| Native American | 162,216 |
| Nigerian | 18,141 |
| Puerto Rican | 21,802 |
| Salvadoran | 17,571 |
| Somali | 79,449 |
| Thai | 6,738 |
| Ukrainian | 22,570 |
| Vietnamese | 33,891 |
| White non-Hispanic | 4,382,534 |
Sources:
Integrated Public Use Microdata Series from the U.S. Census Bureau, American Community Survey. (2019-2023).