Our annual dashboard provides you with a snapshot of quality of life in our state across a range of topics.
get the pdf
Minnesota's population at a glance
| 2020 | 2024 | |
|---|---|---|
| Overall population | 5.7 million | 5.8 million |
| Twin Cities | 3.2 million | 3.2 million |
| Greater Minnesota | 2.5 million | 2.6 million |
| Children and youth (age 0-17) | 1.3 million | 1.3 million |
| Twin Cities | 743,000 | 720,000 |
| Greater Minnesota | 590,000 | 579,000 |
| Working-age residents (age 18-64) | 3.5 million | 3.4 million |
| Twin Cities | 2.0 million | 1.9 million |
| Greater Minnesota | 1.5 million | 1.5 million |
| Older adults (age 65+) | 925,000 | 1.1 million |
| Twin Cities | 455,000 | 530,000 |
| Greater Minnesota | 470,000 | 528,000 |
| Foreign-born residents | 472,000* | 524,000 |
| Twin Cities | 373,000* | 408,000 |
| Greater Minnesota | 99,000* | 115,000 |
| People of color | 1.2 million | 1.4 million |
| Twin Cities | 920,000 | 1.0 million |
| Greater Minnesota | 318,000 | 375,000 |
* 2019 numbers
Numbers may not add up to totals due to rounding.
Quality of life indicators
Arts & Culture
Adults age 18+ who attended a cultural event in the past year
Adults age 18+ who created or performed art in the past year
Students participating in artistic activities at least once a week
Children & Youth
Students who are connected to a caring adult
Students participating in enrichment activities 3x/wk
Students reporting depression or anxiety symptoms
Civic Engagement
Voted in 2024 election (voting-eligible)
Residents age 16+ who volunteer
Adult neighbors who help neighbors
Early Childhood
Children screened before age 5
Low-weight births
Economy
GDP per working-age adult
Number of available jobs
Median household income (2024 dollars)
Poverty rate
Education
3rd graders who are proficient in reading
8th graders who are proficient in math
Students who graduate high school on time
Environment
Days air quality was rated "good" (Twin Cities)
Tons of greenhouse gas emissions per person
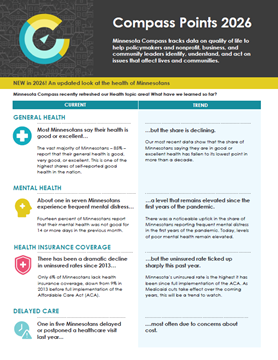
Health
Residents under age 65 who are uninsured
Adults reporting good general health
Adults experiencing frequent mental distress
People delaying or postponing a healthcare visit
Housing
People experiencing homelessness
Households who pay 30% or more of income for housing
Homeownership gap (white, of color)
Public Safety
Serious crimes committed per 100,000 residents
Students who feel safe at school
Adults who feel safe in their community
Premature preventable deaths due to external causes per 100,000 residents
Transportation
Traffic injuries and fatalities per 100,000 residents
Highway miles rated in poor condition
Household income spent on transportation
Annual hours of delay per auto commuter (Twin Cities)
Average number of jobs reachable within a 30-minute commute by foot or transit (Twin Cities)
Workforce
Proportion of adults working
Adults age 25+ with a bachelor’s degree
Graduation rate at 4-year institutions (within 6 years)
Graduation + transfer rate at 2-year institutions (within 3 years)