Race and ethnicity

We track data on race and ethnicity to help better understand the strengths, needs, and quality of life of diverse groups in our communities, and the differences and disparities among those groups.

Young black parents, father is holding a little girl who is about two

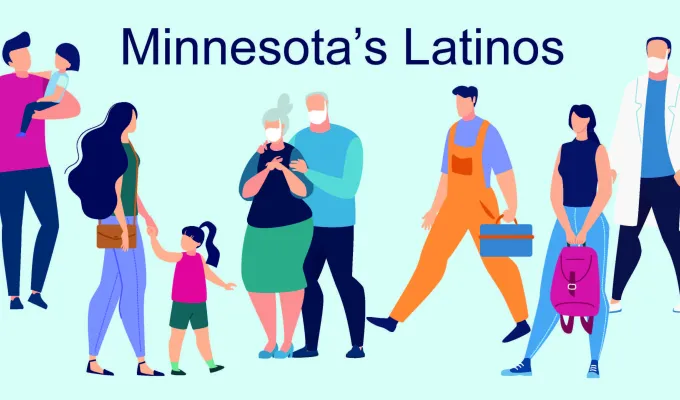
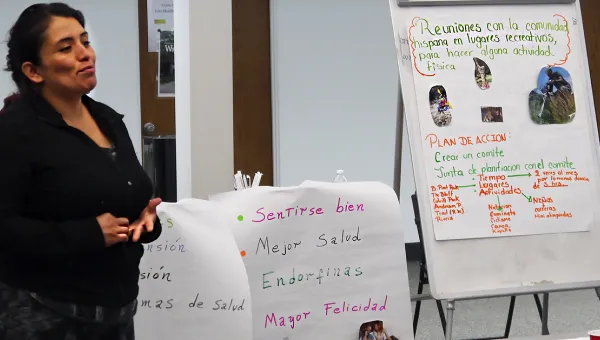
Cultural communities

We developed data profiles for 27 of the largest cultural communities in Minnesota, including African American, Chinese, Ethiopian, Filipino, Hmong, Indian, Korean, Mexican, Native American, Somali, Vietnamese, and more, based on a combination of self-reported race, ancestry, birthplace, and parental characteristics.

Asian mom with two children

Immigration

Nearly half a million immigrants call Minnesota home, a population that includes citizens and non-citizens, students and workers, and refugees who fled their home countries. Immigration will continue to shape our communities for generations to come.

Muslim African family

Biological sex at birth

We track demographic and disparities data by sex to better understand key indicators of quality of life and equity for all of Minnesota’s residents.

Two young people at the table

People with disabilities

Local, state, tribal, and federal agencies use data to plan and fund programs for people with different abilities and disabilities to provide health care, social support, and other services; evaluate government programs and policies to ensure they fairly and equitably serve the needs of all groups, and enforce laws, regulations, and policies against discrimination. 

Photo of woman in wheelchair in an office meeting by Marcus Aurelius from Pexels

Diversity index

What is the probability two people selected at random would be from different racial and ethnic groups? Minnesota Compass compares diversity in Minnesota's counties in 2010 and 2020 and the percent of change between those two years.

Multi-racial group of adults

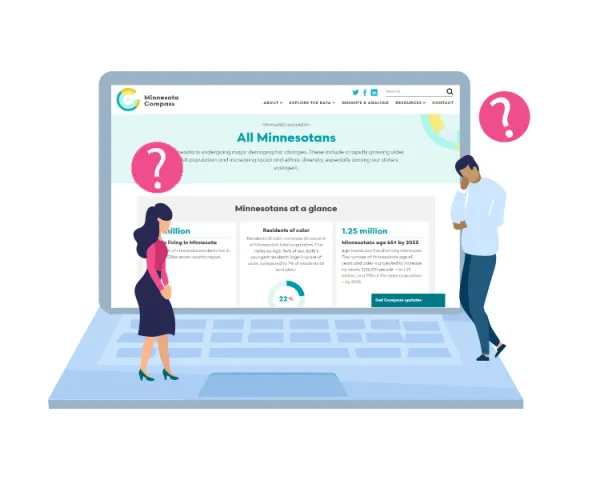
Why aren't I represented on Compass?

Our mncompass.org users frequently ask Compass staff if they can get more data on a specific demographic group not represented on our website. Research Associate Anne Li shares three things to know about our demographic data and why it can be difficult to retrieve specific data.

Conceptual illustration of two people on a giant laptop searching for information. They have question marks over their heads.

Racial equity resource directory

 This directory serves as a hub for finding and connecting with people, programs, and organizations working together to increase cultural competence and combat institutional racism.

Office meeting with a diverse staff

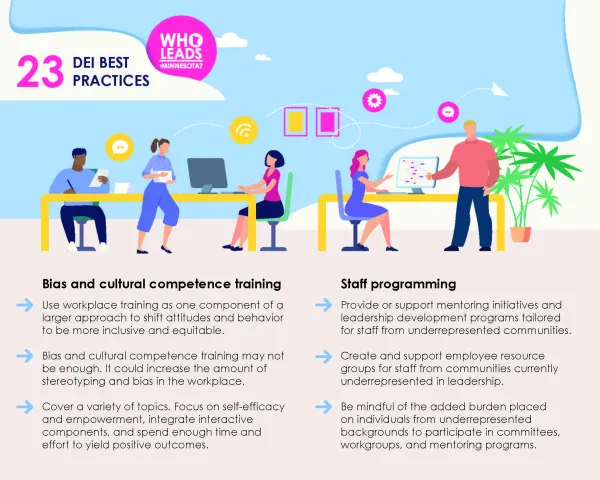
DEI promising practices for leaders

Wilder Research conducted a literature review to better understand which diversity, equity, and inclusion (DEI) policies and practices in the workplace have been found to make an impact. 

Page from best practices

Leadership program directory
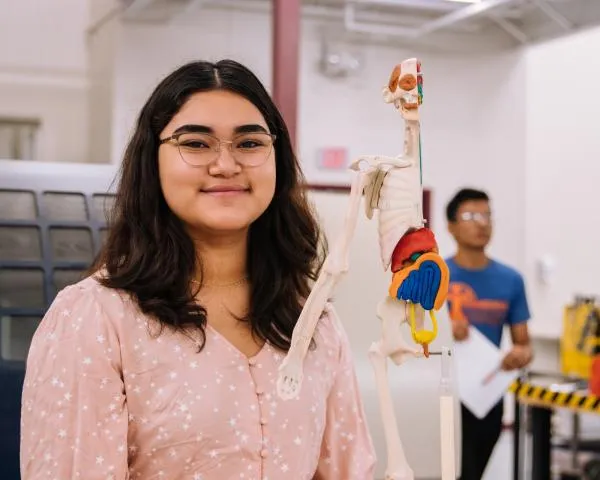
This directory provides a list of leadership development programs for Minnesota residents—particularly residents who are from communities that are underrepresented in leadership positions—who are interested in developing or supporting the development of individual, organizational, or community leadership abilities.

Illustration of diverse office

STEM access toolkit

An ecosystem approach shifts responsibility for STEM learning and success from individual learners to educators, organizations, funders, policymakers, and systems. This toolkit shares ways stakeholders can help with STEM growth.

Young woman in a biology class, photo by jeswin-thomas on unsplash
Screenshot of "Individuals below the poverty level" demographic chart. Chart can be found at https://www.mncompass.org/chart/k203/poverty#1-6764-g

Storytelling with data: Where do I begin?

You have an important story to tell. Whether it's to a funder, policymakers, or your constituents, data can help you paint a clearer picture of your community or those your serve. Allison Liuzzi presents a primer on how to find the data you need.

Screenshot of the Build Your Own profile tool, showing a map and tool menu

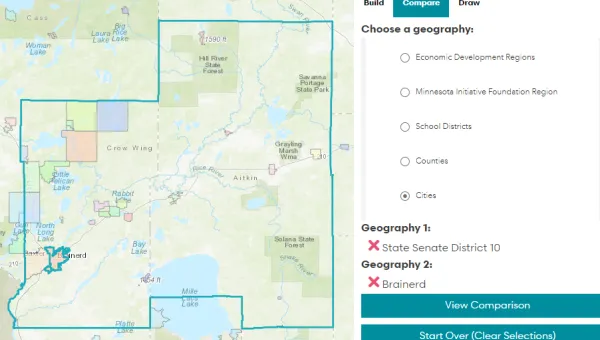
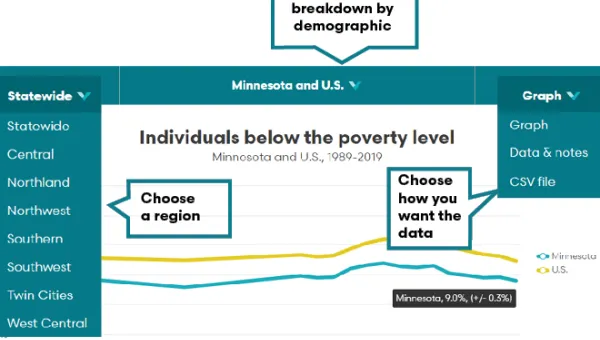
Choose your data adventure: Build Your Own data profile

Get ready to choose your own data adventure, Minnesota, with the Build Your Own statewide data tool. In this article, we share how you can use this tool to customize data for your Minnesota community.

Hispanic woman facilitating a meeting. Items on the flipchart next to her are in Spanish.

Learn how others use Minnesota Compass data

Not sure how data can help you with your planning or policy work? Meet some of the Minnesota Compass users and learn how data make a difference in the work they do and the people they serve.