Compass researchers share the trends (and accompanying graphs) they found most meaningful or surprising in 2013.
Education
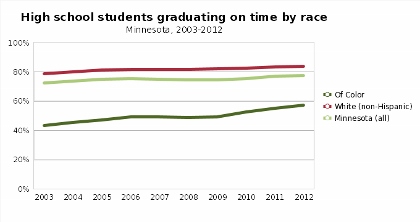
"I am encouraged to see that on-time high school graduation rates for Minnesota’s students of color continue to increase." – Allison Liuzzi
Fewer than half of our state’s students of color were graduating on time through 2009. We’ve seen steady improvement since then, due in large part to steady increases in on-time graduation among Black and Hispanic students. Our most recent data show that 57 percent of Minnesota’s students of color now graduate within four years. We know that the majority of job openings in the next decade will require some education beyond high school, and our continued economic well-being depends on being able to home grow the skills we need in our emerging workforce.
View key measure: High school graduation
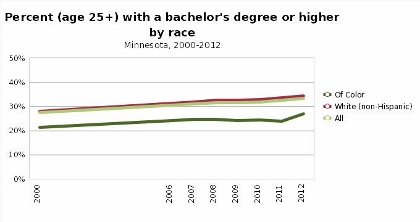
"I was pleased to observe signs that the bachelor’s degree gap between white and populations of color is shrinking." – Peter Mathison
This was due largely to an increase in the number of adults of color with a bachelor’s degree or higher. This shrinking gap is especially encouraging due to the fact it had been growing each year since the beginning of the recession, and because it means more adults of color are getting college degrees. However, due to relatively large margins of error, we have to be careful about drawing sweeping conclusions from these data. Furthermore, the data show that the bachelor’s degree gap between white and adults of color remains large, and as such the work to eliminate this gap is far from over. Overall though, I’m cautiously optimistic about the direction of this trend, and I look forward to keeping an eye on these data points in coming years.
View key measure: Educational attainment
Employment
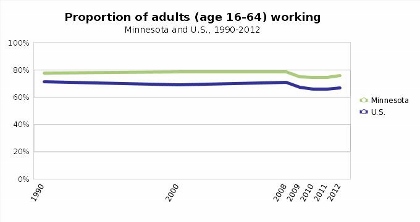
"Proportion of adults working is on the rise and higher than the nation's average." – Nina Eagin
Minnesota and the Twin Cities continue to see a rise in the proportion of adults working since its lowest point in 2010. While still trying to get back to 2008 levels, it is great to see an upward trend in these numbers. It is interesting to note that Minnesota and the Twin Cities continue to have around 10 percentage points more of their adults working than the national average.
View key measure: Proportion of adults working
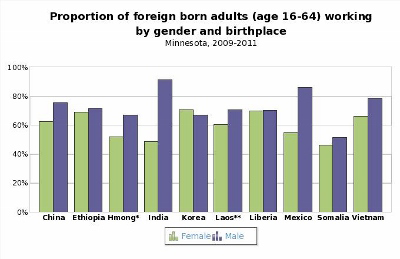
"Most interesting to me is the graph showing the share of foreign born adults working by gender and birthplace." – Ruth Hamberg
That's a mouthful! Here are the questions it answers: Are immigrants from some countries more likely to get a job than immigrants from other countries? Does it matter whether they're men or women? The answer is yes. Both of those matter, and the data (country of origin and gender) interact in interesting ways. There are 24 percentage points between Hmong men and Indian men that are working, but only 3 percentage points for the women. What does that look like in the home and workplace? This graph, which was updated this year with the newest census data, reminds me that we need to look for the deeper story in data.
View key measure: Proportion of foreign born adults working
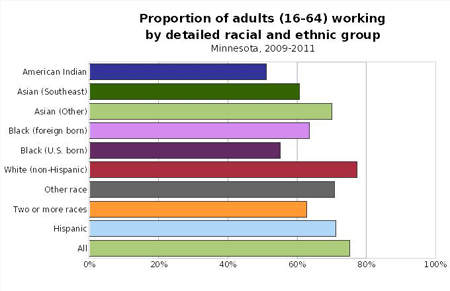
"While Minnesota continues to lead the nation in overall employment, we do not rank well for some racial groups." – Craig Helmstetter
In 2010 the Economic Policy Institute’s “Uneven Pain” report struck a nerve, showing that the Twin Cities had the largest gap in Black-white unemployment rates among the nation’s major metro areas. Our most recent analysis of the Census Bureau’s data remain startling: While Minnesota continues to lead the nation in both overall employment (ranking 3rd at 76% employed) and among non-Hispanic whites (4th at 78%), we are not faring nearly as well among several other racial groups, especially among African Americans (32nd at 59%) and American Indians (45th at 51%). Let's hope that the continuing economic recovery and the hard work being done on this issue by many employers, government, and community organizations, improves the employment picture for all Minnesotans in 2014 and beyond.
View key measure: Proportion of adults working
Housing
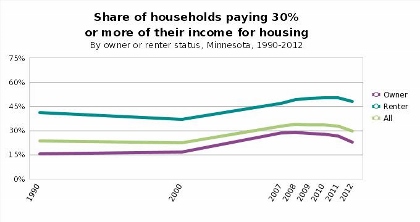
"One of the many data points that surprised me was the decline in the share of Minnesotans who pay “too much” for housing." – Jane Tigan
With so much in the news about increasing rents, I wanted to find out more about the decline in households paying “too much” for housing (also known as cost-burdened households). I asked housing data gurus Leigh Rosenberg from Minnesota Housing Partnership and Jessica Deegan from Minnesota Housing, for their insight about the “why” of the data point and they delivered! Leigh pointed to improvements in employment and, especially for new homeowners, more affordable housing prices, as two potential causes for the decline. Jessica noted that the trend is not the same for low-income renters; we’re still seeing that too many of these households pay more than 30 percent of their income in rent. The historically low rental vacancies in 2013 (also making the news) that are driving up metro rents won’t be reflected in the data until next year. Thanks to Leigh and Jessica for the great input!
View key measure: Homeownership gap
Poverty
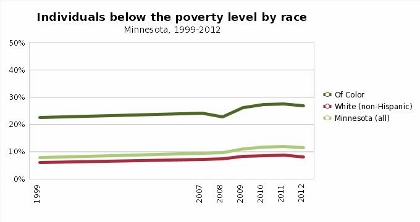
"In spite of the fact poverty is significantly down compared to last year (about 24,000 fewer people in poverty statewide), Minnesota continues to have huge racial disparities." – Megan Chmielewski
Poverty among whites is significantly lower than the U.S. average, but poverty among people of color is significantly higher than the U.S. average. That may be surprising, because we often look just at our overall poverty numbers, which hide that gap. Minnesota takes pride in being one of the best in the nation on many quality-of-life measures, but we need to make sure those opportunities are shared by all Minnesotans.
Join the conversation at @MNCompass -- remember to share your most compelling graph. Tweet #graphoftheyear now.