Most people are aware of the U.S. Census Bureau’s Decennial Census that every American household fills out once a decade, but fewer are aware that the Census Bureau puts out Population Estimates every year, using birth, death, and migration rates to estimate the population of the United States by age, sex, race, and ethnicity at all geography levels. It turns out a lot can happen between one census and the next! Megan shares some interesting patterns the estimates bring to light.
At the national level, nearly all states, including Minnesota, saw their total population increase from 2000 to 2010, but a look at the Population Estimates reveals a more interesting picture.
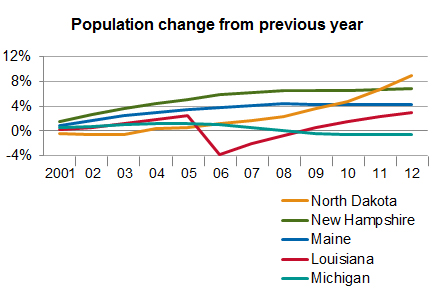
While Minnesota and most other states have seen a fairly steady population increase over the last 12 years, there are some distinct variations. For example, Maine and New Hampshire saw large increases before leveling off at the end of the decade. North Dakota’s oil boom is causing a huge growth spurt that began in the mid-2000s. In contrast, Michigan started to experience a steep population decline at about the same time due to collapse of the automotive industry. Hurricane Katrina wreaked havoc on the population trends in Louisiana throughout the decade.
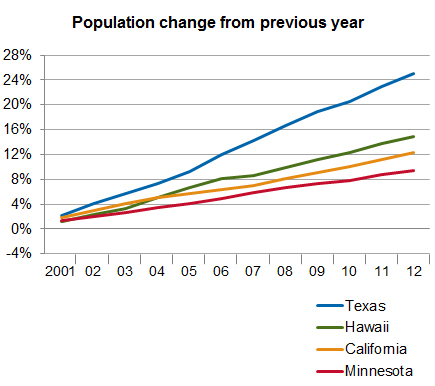
Even states that grew fairly steadily did so at different rates. In particular, more diverse states generally grew at a faster rate, because much like we see in Minnesota, populations of color all around the country have grown at a faster rate than the white non-Hispanic populations.
With the recently-released 2012 county-level Population Estimates from the U.S. Census Bureau, we can also take a look at those same kinds of stories within Minnesota.
Minnesota Compass has several graphs on county-level population and change, including a map that shows the concentration of the state’s population around larger cities -- the Twin Cities, Duluth, Rochester, and St. Cloud. Another map shows the huge population growth in the past decade in the Twin Cities suburbs and exurbs-- those forming an “outer ring” around the Twin Cities -- and the population decline in parts of outstate MN.
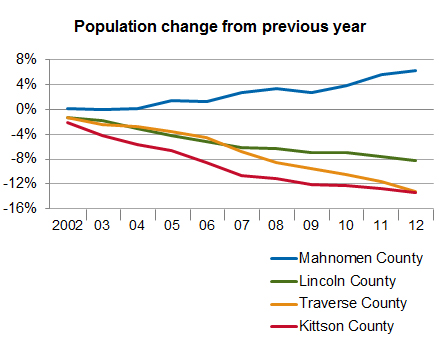
Digging deeper into the data reveals interesting patterns in Minnesota’s population over the past decade. In general, smaller counties are getting smaller and larger counties are getting larger.
Of the 40 counties with the smallest populations in 2000, 31 counties saw their populations drop further by 2012. Mahnomen County, located entirely within the White Earth Indian Reservation, is a notable exception, with nearly 7 percent growth since 2000, largely among Native Americans.
Fifty counties have seen at least a small population increase since 2000. But, as we saw at the national level, that figure doesn't tell the whole story.
Exurban counties, including Isanti, Chisago and Sherburne, grew tremendously in the early 2000's, but that growth leveled off significantly when the recession hit, presumably a combination of workers opting for lower commuting costs and the housing market crash limiting the ability of city dwellers who may once have moved to the suburbs to sell their homes.
That leveling is starting to become evident at the regional level in the Central Region, home to many exurban counties. Nearly all counties in the region have seen growth level off or even dip slightly since the start of the recession. (Stearns, home of most of St. Cloud is an exception.)

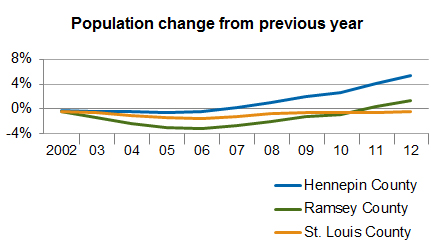
Urban counties tell an interesting story as well. Hennepin County, home to Minneapolis, had no population growth for the first half of the decade, but has grown tremendously since 2007. Ramsey County, home to St. Paul, lost more than 15,000 people between 2001 and 2006, but growth since then has more than made up for that loss. St. Louis County, home to Duluth had a similar U-shaped pattern, losing almost 3,000 people from 2001-2006, then gaining back 2,000 by 2009, and holding steady since.
If you are interested in looking at the population change over the past decade in your own county or region, take a look at the Data & Notes section of any MNCompass graph. This under-utilized feature lets users see the detailed data behind the chart, and even download that data to Excel so that you can create your own charts and graphs to tell your story.
And don’t forget to check back with Minnesota Compass later this summer when we will have updated population estimates by age and race.