This month, former Compass researcher Jane E. Tigan answers questions to help you find and interpret data on Compass at a variety of geographic levels.
The state-level information that Compass provides is great, but where can I find data about my county or city?
We know that a lot of people like to have data about the state as a whole, but also want to be able to say what is going on in their own area. For that reason, we provide data for all 87 of Minnesota’s counties, and the 55 cities with populations over 20,000. You can access this data in two ways: by region and by topic area.
To access data by region, click on your region of the map of Minnesota from the homepage (or use the dropdown found at the top right of every page). Each of these regions contains profiles for every county and major city within the region. Each profile includes demographic information and aggregates the information we have for that county or city in all of our topic areas.
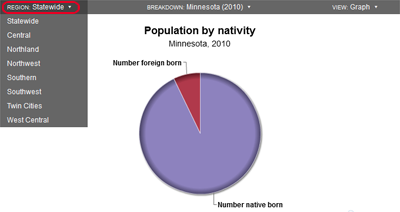
To access data by topic, click on the drop down menus in the Key Measures section of each topic. First, select your region of interest for region-level data:
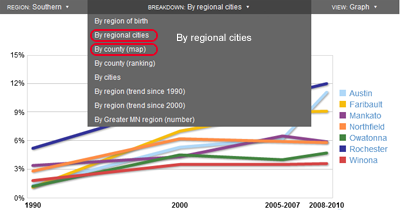
Then, find additional data by county and city under the “Breakdown” menu:
So what about Wayzata, Willmar, Worthington and other smaller cities?
Well, we do population counts for even those cities with less than 20,000, but beyond that the offerings are limited, due to data and resource limitations.
We encourage users to consider the broader context in which the town might operate—for that perspective, county-level, or even state-level data can be useful. Use Minnesota Compass to provide an overarching story for your work, and then rely on community-based and local wisdom to draw attention to local similarities or differences.
For example, while Compass isn’t able to provide detailed information beyond population counts for a town like Worthington, you can look to data about Nobles County (the city makes up 60% of the county’s population) and use it to talk about trends within or that are likely impacting Worthington. Did you know that Nobles ranks 3rd in the state for the share of the population who are of color (that’s up more than 15 percentage points since 2000)? 1st for the share who are foreign born? And, that nearly 1 out of 3 children in the county are Hispanic? Trends like these can give us a context to talk about what’s going on in Worthington.
In the Twin Cities region, we also offer profiles by neighborhood, thanks to support from the McKnight Foundation. Because some neighborhoods in Minneapolis and St. Paul have dense populations, we are also able to reliably look at specific attributes such as educational attainment, poverty rates, and other measures.
Why can’t I find data at all geographic levels broken down by race, gender, age and income?
That’s a great question. The Minnesota Compass web site has the most “depth” at the state-level. For example, you can find some of our key measures with breakdowns as detailed as: the proportion of foreign born adults who are working, by years in the U.S. and gender. We also have context demographics like race and ethnicity; world region of birth for the foreign born population; poverty level by age; and other measures that help provide population characteristics. Currently, Compass stops short of providing all the detailed breakdowns for major cities because of staff and data limitations. For some of the 55 cities that we track, the data simply aren’t available in a comparable format, or do not exist for us to get a reliable sample. This is another instance when telling the story using broader trends and bringing in local knowledge about the issue is critical.
If you can't find what you are looking for, please feel free to contact us. We can often point you to what you need.