by Ellen Wolter
(Updated 2021) Our updated Build Your Own tool allows you to access data from anywhere in Minnesota and customize it for your community. We developed the tool to better meet the needs of greater Minnesota communities, whose residents told us that "greater Minnesota is not the same" and emphasized the need for more options to access data for communities throughout the state.
Our powerful new tool will help you explore questions like,
|
"How do educational attainment, unemployment, and poverty rates compare across school districts in my region." |
|
"How many children in my five-county program service area live in poverty and how does it compare to the entire region?" |
|
"What are the demographics of my state House and Senate districts? How do they differ from my neighboring districts?" |
|
"How many residents living in my Economic Development Region are without a car or are housing cost-burdened?" |
|
"How does my community fit into the bigger picture of the region?" |
To get you started, here are four ways to choose your own data adventure.
Data adventure #1: build a profile
Building your own profile provides with you with options beyond data for your city or county.
With the Build Your Own tool, you can build a profile across the state by selecting a single geographic area or combining geographies, including:
- Cities
- Counties
- School districts
- Minnesota Initiative Foundation Regions
- Economic Development Regions
- MN House Districts
- MN Senate Districts
- US Congressional Districts
- Zip codes
- Census tracts
The Build Your Own tool combines data for all of the geographic areas you have selected into one data profile.
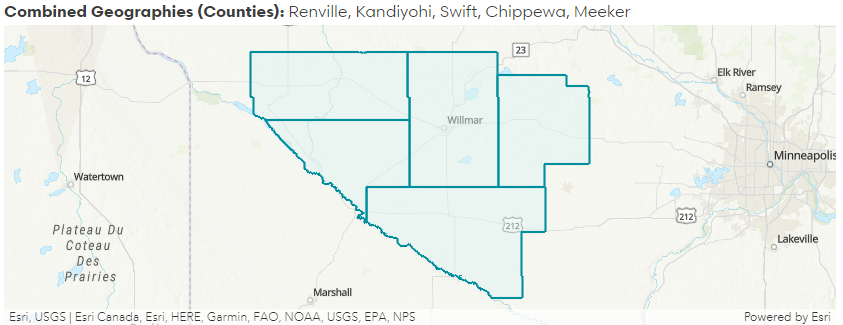
For example, suppose you work in a nonprofit organization that serves five Minnesota counties: Kandiyohi, Renville, Meeker, Chippewa, and Swift. A grant application asks for the poverty rate for your entire service area. Using the build feature, you can select all five counties and create a customized profile to learn that the poverty rate for this five-county service area is 11 percent.
Data adventure #2: compare profiles
With the Build Your Own tool, you can compare profiles for two communities of interest to see how they are similar to and different from one another.
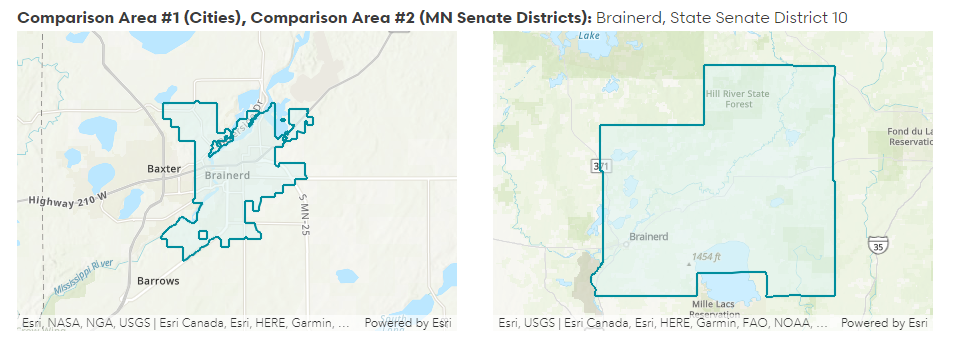
For example, imagine you live in Brainerd and you are lobbying your state legislators on issues related to housing. Two of the newest geographies in the Build Your Own tool are Minnesota House and Senate Districts. You can use the compare feature to see how the City of Brainerd differs from Senate District 10 overall on key characteristics like home ownership. Data in the comparison profile show that renting is much more common in the City of Brainerd than across Senate District 10:
- 91 percent of households are occupied in Brainerd, compared to 60 percent of households across the district. This is likely due to a large share of seasonal homes and cabins across the district.
- Nearly half of all occupied housing units in Brainerd are rentals, compared to about a quarter of housing units across the district.
Data adventure #3: build and compare profiles
You can also use the Build Your Own tool features together to build your own data profile and compare it to another area.
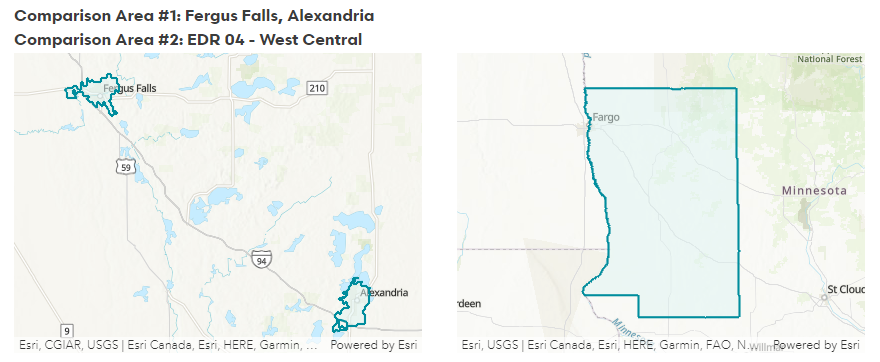
For example, suppose you work for a regional hospital, with locations in Alexandria and Fergus Falls, which is working to prevent social isolation among older adults. You are creating your strategic plan and need to know the share of older adults in both cities who live alone, compared to older adults across the entire region. The Build Your Own tool allows you to build a profile that combines Alexandria and Fergus Falls, and then to compare that profile to the West Central Economic Development region. You learn that a greater share of older adults in Alexandria and Fergus Falls live alone (14%) than in the West Central Economic Development region (11%).
Data adventure #4: draw a profile
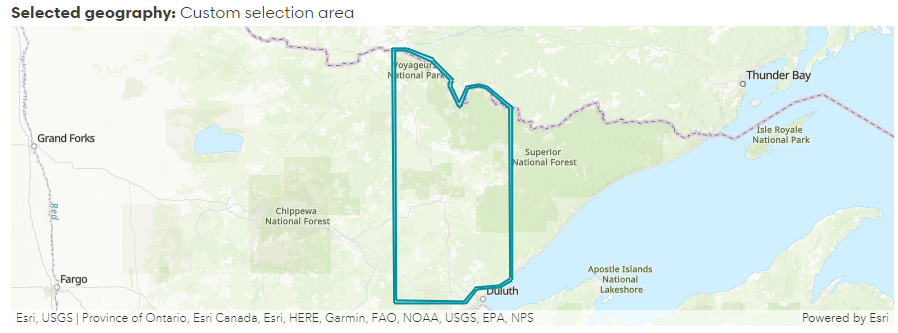
While traveling across the state, we learned that it is challenging for residents to get data for areas that do not have pre-defined boundaries, like cities, counties, or regions. In St. Louis County, for example, residents remarked that it can be difficult to access data for more rural communities without including Duluth, a more urban community. With the draw feature, you can draw an area on the map – excluding Duluth – to learn about community needs in northern St. Louis County. Doing so, we learn about unique transportation needs and barriers in the northern region of the county:
- 60 percent of workers in northern St. Louis County live 10 miles or more from their employment location.
- 30 percent of workers living in northern St. Louis County travel 30 minutes or longer to work.
- About one-third of workers living in northern St. Louis County are employed in Hibbing or Virginia.
Plus other enhancements! You asked, we listened!
You might also notice a few enhancements to our pre-selected geographic profiles. They now feature:
- Enhanced data for select city, county, and region profiles, including new data on cost of living and wages, transportation barriers, broadband access, child care costs, and more.
- A set of downloadable graphs on some of our most requested topics, which can be used in reports or for presentations.
- Tables with improved layout, including larger headings and the ability to expand and collapse rows of data.
- Improved search functionality so you can easily find the geographic profile that you're looking for.
Ta-da! We are excited to provide you with better tools and information that help you plan for the future, set policy, and ensure effective use of resources for generations to come.
And there's more to come! We will continue to work in collaboration with residents across the state to make data more accessible to greater Minnesota.
Got questions? Need additional support? Want a Compass researcher to provide a tutorial for your group? Get in contact with us and a Compass staffer will be in touch.