The first COVID cases were documented in Minnesota in March 2020. In the weeks that followed we saw cases begin to climb and people begin to socially distance and quarantine. Some were able to limit their potential exposure: working, going to school, and doing grocery shopping online. Others were not, and faced unknown risks every day to go to work, doing jobs that would keep our economy and health care system on track. In mid-March 2020 we began to see governors sign emergency executive orders, first closing bars and restaurants, followed by stay-at-home orders. California was the first state to issue a stay-at-home order on March 19, 2020, with Minnesota following closely behind on March 26, 2020. Conversations during this time had shifted as people weighed the predicted economic cost associated with these closures against the human cost of not taking such measures.
COVID hits the economy
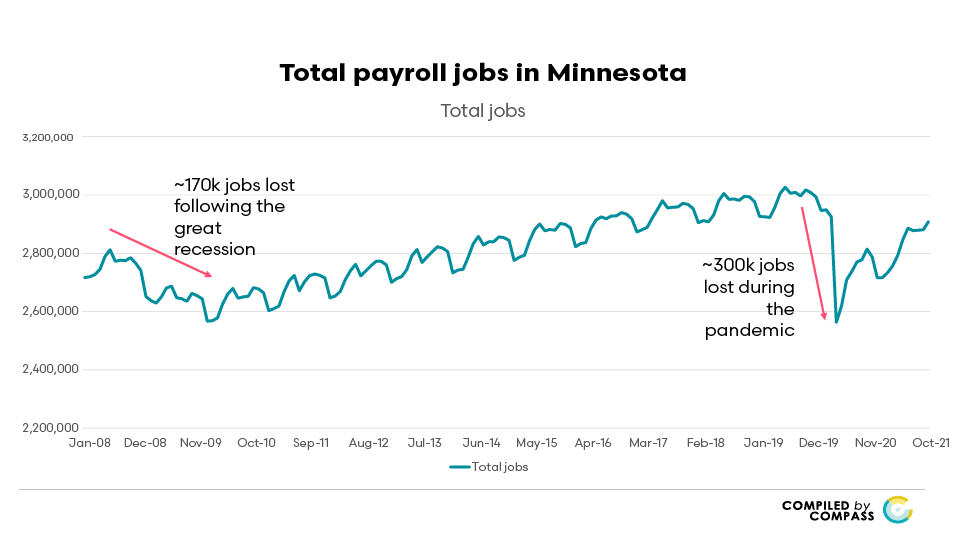
The economic impacts of these restrictions were apparent almost immediately. From March to April 2020, Minnesota lost 362,000 jobs—a more than 12.4% job loss in a single month. To put that in perspective, Minnesota lost about twice as many jobs in a single month at the beginning of the pandemic as it did during the year and a half following the 2008 recession. Minnesota has been rapidly recovering jobs since April 2020, but we’re not yet back to pre-pandemic job numbers.
Comparing Minnesota to other states
Looking at the full year, Minnesota lost 6.9% of its jobs in 2020, compared to 2019. That is similar to the 2020 job loss in North Dakota (6.6%), but larger than in Wisconsin (5.7%), Iowa (5.1%) and South Dakota (3.4%). .
Between March and April 2020, Minnesota lost 12.4% of its jobs. Over the rest of the year our economy regained some jobs. If we average the rate of change over the 12 months of 2020, we see that we lost on average 6.9% of jobs during the year.
Throughout 2020, Minnesota’s death rate remained below neighboring states. Nebraska had the lowest number of deaths with 1,584 deaths due to COVID per one million people, followed closely by Minnesota with 1,590 deaths, and Wisconsin at 1,664 deaths. North Dakota, Montana, and Iowa had similar numbers of deaths, ranging from 2,265-2,382 deaths. South Dakota had the highest per capita death rate with 2,564 deaths per one million people.
In addition to the number of deaths, the number of total cases is an important metric, given what we are learning about the impacts of long COVID, as well as the implications of this caseload for our health care system. Throughout the pandemic, Minnesota’s COVID caseload has tended to remain lower than neighboring states. North Dakota and South Dakota have had the highest rates of COVID since early in the pandemic. During the spring and summer of 2020 there wasn’t a great deal of variation between the states, however during the surge in cases we experienced across the country in fall 2020, we saw clear differences emerge.
So how are we faring?
- Minnesota experienced higher rates of job loss than neighboring states.
- Over the course of the pandemic, Minnesota has had consistently lower rates of COVID cases and deaths than other states in the upper Midwest.
We can see in these trends that policy, state, government mandates, and local policies can impact overall trends—whether for the better (health) or worse (economy).