Co-authored by Justin Hollis, Wilder Research, and Shonni Krengel, Minnesota Council of Nonprofits
When nonprofit wage data suggest leaders earn more than their government and business counterparts, it tells a misleading story—one heavily skewed by hospitals and universities that dominate the sector's employment landscape. This is exactly the kind of methodological challenge that sparked a candid conversation between Wilder Research and the Minnesota Council of Nonprofits (MCN) about data, transparency, and the responsibility that comes with shaping public narratives.
Two reports, different approaches to “eds and meds”
Who Leads in Minnesota, a collaborative project between Wilder Research and sector partners, examines leader demographics across nonprofit, government, and business sectors using survey data. Beyond the partnership with MCN, Minnesota Compass works with the League of Minnesota Cities for government sector insights and the Minnesota Chamber of Commerce for business sector perspectives. This multi-sector approach allows Compass to examine leadership patterns across three sectors that shape Minnesota's economic and civic life.
The Minnesota Nonprofit Economy Report (MNER), published annually by MCN, provides a comprehensive economic analysis of Minnesota's nonprofit sector using state employment data.
These aren't competing reports—they're complementary views that handle the "eds and meds" challenge differently, each serving distinct research questions and policy needs. The MNER counts nonprofit employers; Who Leads counts individual leaders. The MNER uses data provided by the Minnesota Department of Employment and Economic Development and the IRS Masterfile; Who Leads uses survey samples that capture demographic details often missing from administrative records.
When hospitals and universities dominate the data
The email exchange that prompted this article began with a pointed observation from MCN about how wage data could be misinterpreted. The concern reflected broader challenges facing the sector, including heightened scrutiny of nonprofit operations, increased attention to financial oversight following high-profile cases, and growing questions about organizational priorities—all creating an environment where data can easily be taken out of context or weaponized against mission-driven work.
It's the kind of feedback that reflects genuine sector concerns rather than methodological criticism. It sparked a productive conversation about the outsized influence of hospitals and universities on nonprofit sector statistics and our shared responsibility to present data in ways that serve rather than harm the organizations we study.
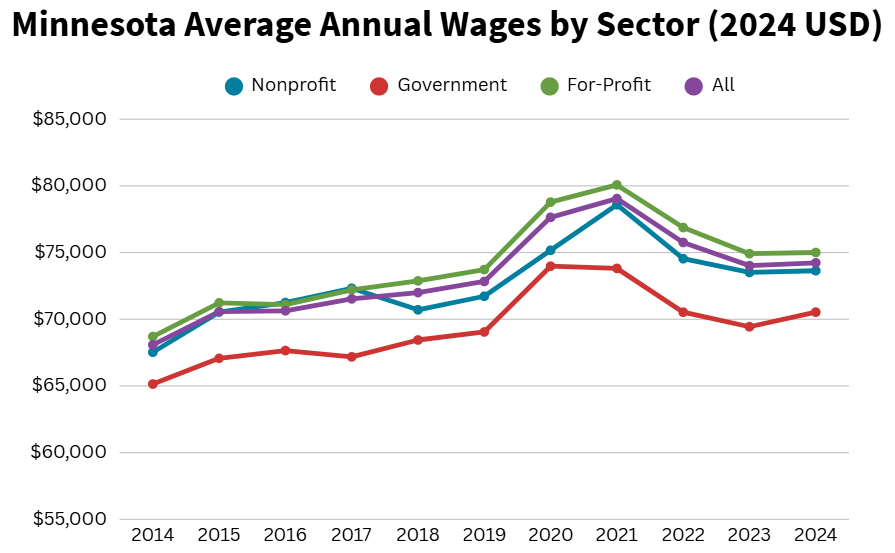
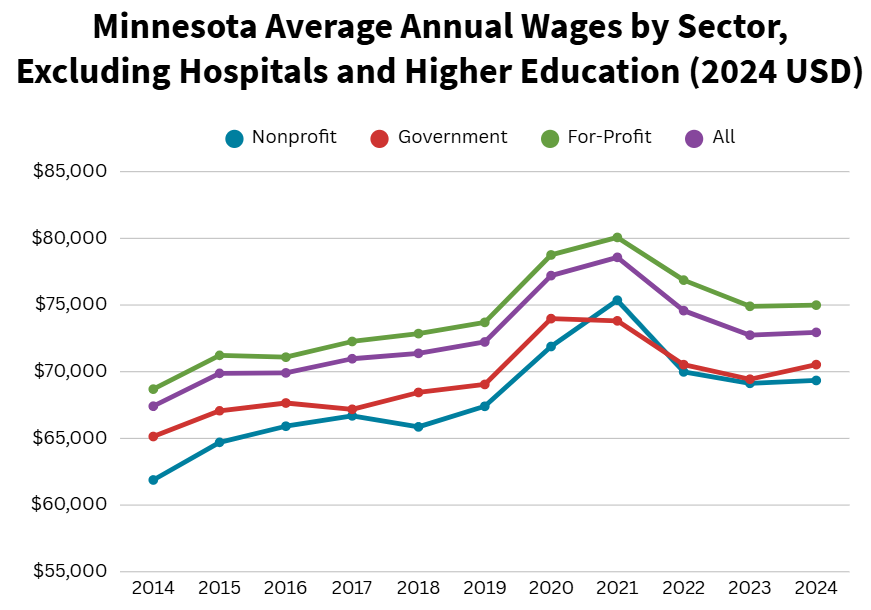
The core issue is straightforward: hospitals and universities account for 79% of all nonprofit employees in Minnesota, yet “eds and meds” only account for 24% of all nonprofit employers. These organizations employ large numbers of highly compensated leaders—chief medical officers, deans, hospital CEOs—whose salaries dwarf those at smaller nonprofits. When these "eds and meds" leaders are included in sector-wide wage analyses, they create a distorted picture of nonprofit compensation that doesn't reflect the reality for the majority of Minnesota nonprofit organizations. The average annual wage for Minnesota’s nonprofit sector in 2024 was $73,600. When hospitals and higher education are removed, the average annual wage drops to $69,300 – a difference of more than $4,000.
While Minnesota Compass's approach to capturing the full leadership landscape amplifies the wage premium that comes with health care and education leadership roles, MCN’s, by contrast, strategically excludes “eds and meds” from certain wage analyses to provide a clearer picture of compensation for the majority of nonprofits.
MCN’s feedback prompted Compass to reconsider presenting wage data for nonprofit leaders. As noted by our sector partner, certain statistics could fuel harmful narratives about nonprofit spending at a time when the sector faces widespread uncertainty in public policy, including federal funding shifts. This concern is especially acute given recent scrutiny following fraud cases in Minnesota and potential threats to tax-exempt status for some nonprofits.
The skewing effect in practice
To understand why this matters, consider the salary difference between a hospital CEO managing a billion-dollar health system and an executive director running a food shelf with three staff members. Both appear in nonprofit leadership data, but their compensation levels—and the factors that drive them including organizational revenue—are worlds apart.
When “eds and meds” are included in wage comparisons:
- Nonprofit leaders appear to significantly out-earn peers in government and business
- The data might cause compensation misperceptions for nonprofit job seekers
- Public perception could shift toward viewing nonprofits as overpaying executives
When “eds and meds” are excluded:
- Compensation gaps between sectors narrow considerably
- Community nonprofit wages are found to be more modest and mission-appropriate
- The data better reflect the financial reality for the majority of nonprofit organization
How wage data are presented can have real consequences for public trust and policy support.
A conversation with Shonni Krengel, research manager at Minnesota Council of Nonprofits
When you first saw our preliminary wage data estimates that could suggest nonprofit leaders out-earn their government and business counterparts, what was your immediate concern?
Harmful narratives about nonprofits continue to impact our sector’s ability to access funding and resources we need in order to ensure our communities have access to essential services.
According to MCN’s 2025 Current Conditions report (read the full report here), nonprofits are facing stagnant or decreased funding from government, philanthropy, and individual donations. At the same time, demands for services have been increasing and we are anticipating more to come as social safety net programs such as Medicaid and SNAP are cut from communities who need it the most.
Data on nonprofit wages must be viewed with additional context. Nonprofits often compete with corporate and government sectors to retain and attract the best talent – leaders who are expected to address and possibly solve our society’s most pressing and complicated needs. MCN believes that each organization and their leaders are the appropriate entities to determine their own salary and benefit offerings. Nonprofits can make profit; the difference is that any profit is reinvested back into the organization and their mission. Nonprofits are businesses who receive tax-exempt status because of the contributions we make to better our communities and because of that, nonprofits are subject to more stringent reporting requirements with higher standards of public accountability.
The reality is that many nonprofits are struggling to stay afloat and skewing data by including hospitals and higher education who represent a small part of our sector means that the majority of Minnesota nonprofit organizations will be severely underrepresented.
How does excluding "eds and meds" from wage analyses in the MNER change the story about nonprofit compensation?
Minnesota nonprofits’ work reflects a broad array of activity areas, and each of these categories benefit the public in a different way. The majority of financially active nonprofits in Minnesota are considered small and report an annual revenue of less than $1 million (compared to for example, the Mayo Clinic, which reported a record operating income of $1.3 billion in 2024). Organizations with smaller operating budgets are more likely to be found among the arts, religion, and environmental issues. In contrast, large organizations (annual revenue of $5 million or higher) only make up 11% of all financially active nonprofits. These organizations tend to be in health and human services.
The health care field (including hospitals, clinics, and nursing homes) employs the largest number of nonprofit workers (68%), yet it only constitutes 8% of employers and, therefore, skews average wages that do not reflect the reality for most nonprofit employers.
We can see this effect in other ways. In MCN’s MNER, we have nonprofit average annual wages by region. Because the Mayo Clinic is located in Rochester, MN, the Southeast region of MN has significantly higher annual wages ($93,192) compared to all other regional wages (even the Twin Cities with an average annual wage of $73,621). These two data points highlight the influence that hospitals and higher education have on nonprofit compensation and the nuance needed for a more accurate and complete view of nonprofit sector wages.
What does good research partnership look like when handling sensitive data that could be misused?
Data that does not acknowledge the nuances of nonprofits can possibly affect the public’s perception of nonprofits and impact policy decisions at the state Capitol. In addition to wage data that often receives scrutiny from legislators, there are also concerns raised (mostly by those who do not work in nonprofits) that there are “too many” nonprofits. According to the IRS Masterfile, there are over 38,000 tax-exempt entities. In reality, only about 10,000 are financially active and the majority of nonprofits are volunteer-run, hyper-local organizations including booster and youth clubs, firefighter associations, and parent-teacher organizations.
Research is a wonderful way to track patterns and uplift voices, but it must be used mindfully and with intention. Therefore, nuances, like the exclusion of hospitals and higher education that skew sector data, should be considered whenever possible. Conversations, like the one we had with Minnesota Compass, are a great example of partnering to uplift sensitive data across different methodologies and projects.
What we learned about the "eds and meds" challenge
This collaboration taught us several lessons about handling dominant subsectors in research:
Context is everything. Raw wage comparisons without accounting for sectoral composition can mislead policymakers and the public about nonprofit compensation practices.
Methodological transparency matters. Both approaches—including and excluding “eds and meds”—are valid, but readers need to understand what each choice reveals and conceals.
Sector advocacy requires nuanced data presentation. In politically charged environments, how we frame findings can determine whether they support or undermine the organizations we study.
Compass's partners at the League of Minnesota Cities and Minnesota Chamber of Commerce have provided similar feedback about dominant employers in their sectors, helping all of us understand how large organizations can skew cross-sector comparisons while identifying patterns that transcend organizational size.
Looking ahead: Beyond the eds and meds dilemma
We encourage other research partnerships to grapple openly with their own version of this challenge—whether it's tech companies skewing business wage data or large municipal systems dominating government employment statistics.
The "eds and meds" dilemma illustrates a broader truth about sector research: the most accurate picture often requires multiple lenses. Whether you're interested in the economic impact of community nonprofits or the demographics of cross-sector leadership, we invite you to engage with both perspectives as complementary rather than competing views.
The 2025 Minnesota Nonprofit Economy Report is available here https://minnesotanonprofits.org/wp-content/uploads/2025/09/2025-MNER.pdf. Who Leads in Minnesota findings are available at https://www.mncompass.org/who-leads-mn.