Indicators dashboard helps promote community
Michelle Landsverk believes there are many people who would love what Thief River Falls, pop. 8,573, has to offer.
The list includes several large, successful employers that are actively involved in the community, new housing, business opportunities, downtown redevelopment, and engaged civic leaders willing to roll up their sleeves and dive right in.
“We’re a dynamic community on the grow,” said Landsverk, the director of Advance Thief River, an economic development initiative for the city and surrounding Pennington County.
But when you are a small, rural community just 70 miles from the Canadian border and with no four-lane highways nearby, how do you convince people and businesses that it’s worth the move?
Add to that a public perception that “wasn’t keeping pace with reality,” Landsverk said. “Some residents and businesses have a ‘glass half empty’ mentality about their own city. We needed to recognize and show all the positive things happening in our community.”
So, she did the numbers.
“We really wanted to quantify the things that made us stand out, and also where to grow. So we created a snapshot of indicators that, over time, we’ll be able to see progress, change, and where we are gaining—and losing—ground.”
MN Compass is one-stop shop for data
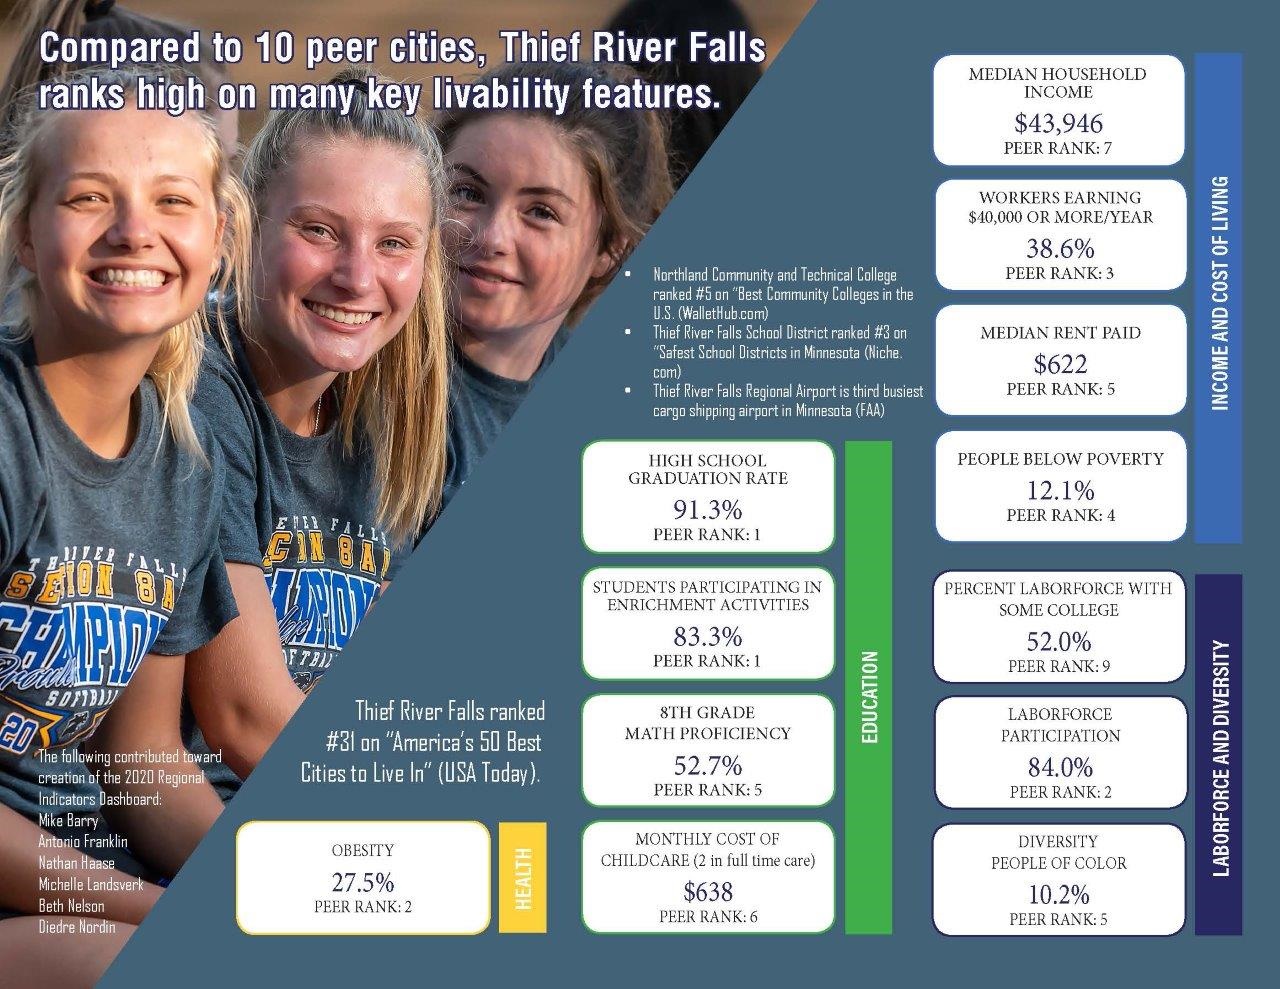
Advance Thief River tapped into the geographic profiles on Minnesota Compass to develop a regional dashboard of 16 community indicators, and compared them to the same data sets of 10 peer Minnesota cities. The indicators include income, cost of living, labor force, housing, diversity, safety, education, health and more.
Landsverk has used Minnesota Compass for several years. “It’s easy to navigate and to find the most important indicators,” she said.
She also appreciates that she can compile and compare data at city, county, and regional levels. “I like that it compares apples to apples. It uses the exact same parameters for each city, county, and region.”
What the data found
Thief River Falls ranked first among the peer cities in lowest percentage of cost-burdened households, workers who live less than 10 miles from their employment, high school graduation rate, and number of students participating in enrichment activities outside of school. They also were number one in broadband, with almost 91% of households in the county having high-speed broadband with download speeds of 100 Mbps.
Were there any “aha” moments from the data?
One was validation for Thief River Falls being named to Wall Street 24/7’s 2018 list of America’s 50 best cities to live. “The indicators were able to quantify why,” Landsverk said.
Some of the indicators also showed room for improvement, including obesity and diversity. Even though both were rated better than many of the peer cities, Landsverk and the Advance Thief River board recognized the numbers were not stellar. “We can apply the data to help us move in the right direction,” she said.
The response to the dashboard has been uniformly positive. “People are thankful to see the information. It resulted in an elevated perception in the community by both businesses and residents. It’s a useful tool for both city and county government,” Landsverk said.
It will also be used for external communication, particularly as a marketing tool for people and businesses interested in making their home in Thief River Falls and Pennington County.
“Now that we have the hard data and there’s more about the community that’s quantifiable, we will use this dashboard as an annual compass to help us.”