Minnesota's leadership landscape is slowly shifting, but significant disparities remain between who shapes our institutions and those who they employ and serve. New data from the "Who Leads in Minnesota?" project – a collaboration between Minnesota Compass, the Bush Foundation, and key sector workforce partners – reveals both encouraging signs of progress and persistent challenges in creating more representative leadership across business, government, and nonprofit sectors.
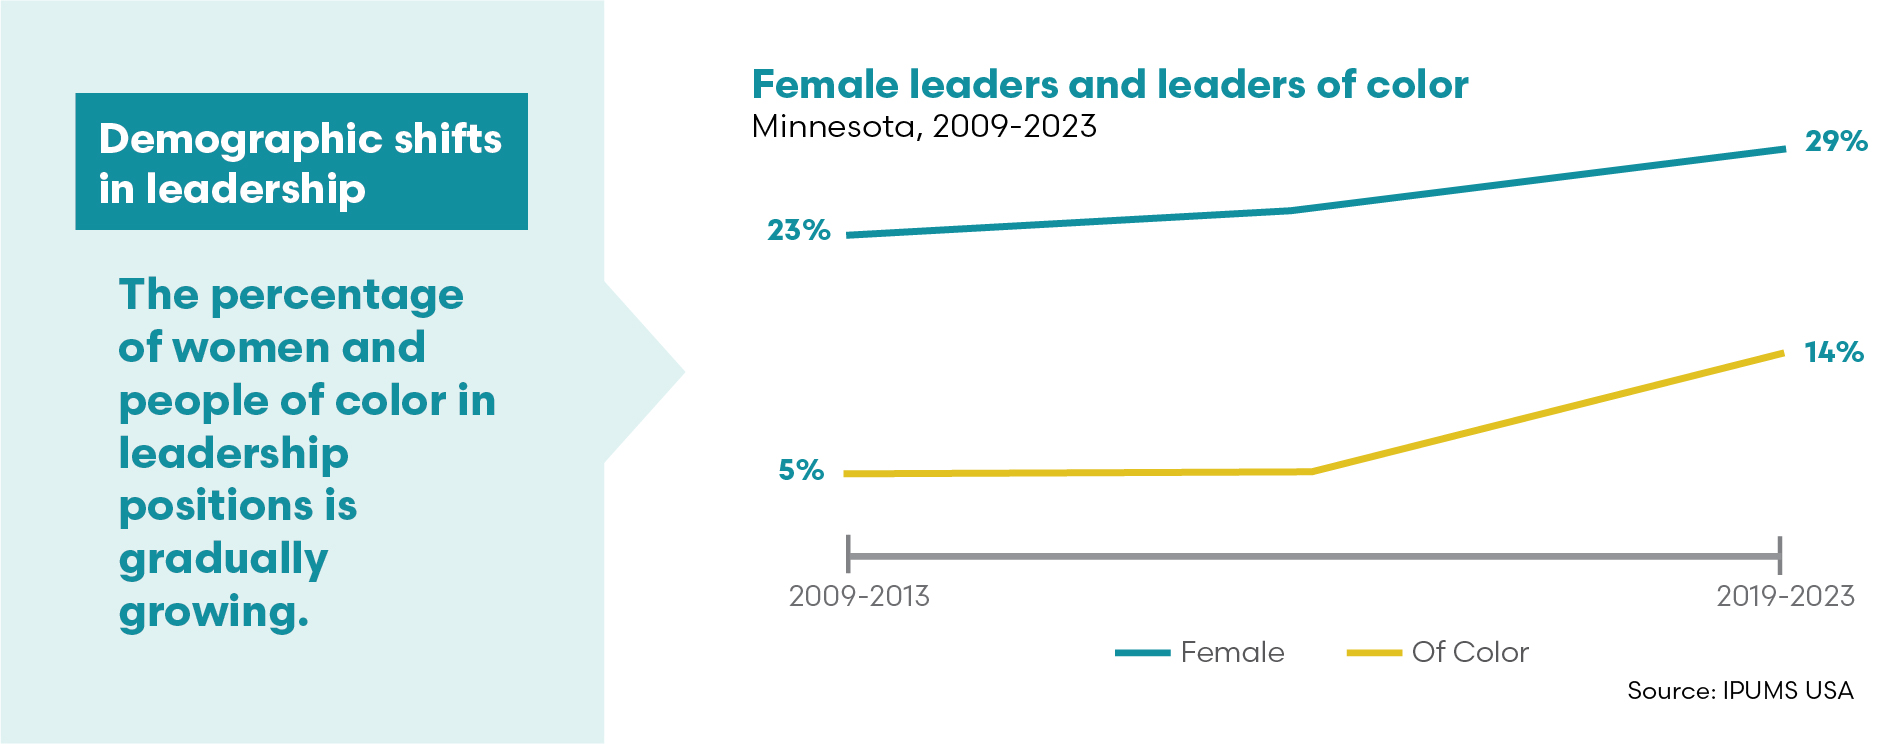
A decade of gradual change
We have seen meaningful gains toward representative leadership over the last decade. The total number of top executives and legislators in Minnesota has grown substantially, from about 20,400 in 2009-2013 to nearly 29,300 in 2019-2023, a 43% increase that reflects both economic growth and expanded data collection.
More importantly, the demographic composition of leadership is beginning to shift. Female representation among all leaders rose from 23% to 29% over the last decade, while representation among leaders of color nearly tripled from 5% to 14%. These changes suggest that efforts to diversify leadership are gaining traction, even if progress remains gradual.
Persistent gaps remain
Despite progress, significant disparities persist across all sectors. The data reveal that Minnesota's leaders are still overwhelmingly white, male, and middle-aged.
Race. While BIPOC Minnesotans make up 18% of the state's population, they represent only 14% of leadership positions overall.
Age. Leadership representation by age shows particularly stark imbalances. Two-thirds of Minnesota's leaders are between 45-64 years old. Adults under 45 are noticeable underrepresented, at 27% of leaders despite making up 39% of the adult population. Questions remain about developing pipelines into leadership and succession planning.
Disability status. Perhaps most concerning is the representation gap for people with disabilities. While 3 out of 20 Minnesotans have a disability, fewer than 1 in 20 leaders report having a disability — a ratio that has remained stubbornly consistent across all time periods studied.
Income. The economic profile of Minnesota's leaders reveals substantial income disparities. Leaders earn a median income of $160,000, compared to just $45,900 for Minnesota adults overall. While 70% of leaders earn $100,000 or more annually, only 12% of all Minnesotans age 25 or older are at this income level.
Educational attainment. Educational attainment among leaders has increased over time, with 72% now holding bachelor's degrees or higher compared to 39% of all adults. This growing education gap suggests that formal credentials are becoming increasingly important as pathways or gatekeepers to leadership positions.
A focus on government leadership: Shifting demographics
Between 2009–2013 and 2019–2023, the demographic makeup of government leaders in Minnesota changed in several notable ways. The percentage of leaders of Color increased from 5% to 21%, indicating progress toward more racially inclusive representation in public service.
At the same time, the share of leaders aged 45 to 54 has steadily declined—from 32% in 2009–2013 to 29% in 2014–2018, and down to 16% in 2019–2023. This pattern suggests a gradual generational shift, with fewer mid-career professionals holding leadership roles over time. Meanwhile, the proportion of veterans in leadership dropped from 14% to 6% over the past decade, raising questions about how different forms of experience are represented in public decision-making. Together, these trends reflect both gains in racial diversity and evolving dynamics in the age and background of Minnesota’s government leaders.
A focus on business leadership: Lagging behind
Business leaders continue to be predominantly male (73%), while nonprofit and government sectors have more gender balance (58% and 51% male, respectively). Women represent just 27% of business CEOs and top executives. Though this marks modest improvement since 2009-2013, it remains far from parity with the overall adult population.
Interestingly, business leaders are increasingly concentrated in the Twin Cities, with 75% residing in the 7-county metro region compared to just 68% a decade ago. This geographic pattern may reflect a growing preference for proximity to business networks and access to professional services, but could also signal a decline in the influence of rural perspectives on leadership culture.
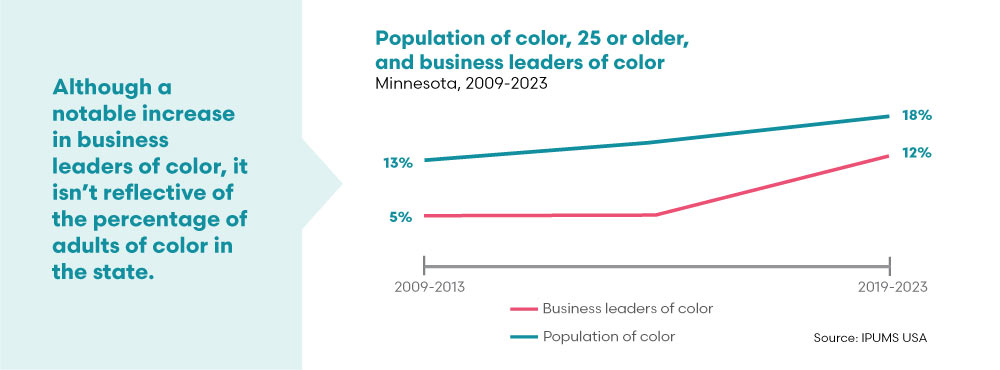
There has been a notable increase in BIPOC leaders’ representation in business—from 5% to 12%—but this still falls short of the 18% needed for parity with their representation in the overall adult population. This gap implies a missed opportunity for businesses to fully tap into the pool of diverse talent available to them.
A focus on nonprofit leadership: At the forefront of inclusive leadership
The most recent 2019-2023 period reveals that leaders of color represent 22% of nonprofit leadership — a substantial presence that suggests parity with racial diversity in the pool of potential leaders age 25 or older. This, combined with the sector's traditionally higher representation of women leaders, suggests nonprofits may be leading the way in inclusive leadership.
What's particularly striking is that nonprofit leaders maintain the highest level of educational attainment, with 87% holding bachelor's degrees or higher, compared to just 70% in business. This suggests nonprofits are continuing to attract highly educated professionals, though it raises questions about whether this shows up as a barrier for leaders with different backgrounds.
While the trends show gradual progress toward more representative leadership, the pace of change suggests that intentional, sustained efforts will be necessary to maximize the state’s potential and achieve lasting demographic parity.
Looking ahead
The Who Leads in Minnesota? project represents more than just an exercise in data collection — it's a call to action. Our research, informed by input from hundreds of community members, aims to provide our institutions with the information they need to foster transformative and inclusive leadership.
While the trends show gradual progress toward more representative leadership, the pace of change suggests that intentional, sustained efforts will be necessary to maximize the state’s potential and achieve lasting demographic parity. Our project's expanded data collection, including new survey data from local leaders, continues to build a foundation for tracking progress and identifying effective strategies.
In our next article, we'll dive deeper into survey responses from nearly 900 current leaders across Minnesota's business, government, and nonprofit sectors to explore the pathways that brought them to leadership and what their attitudes toward diversity and inclusion might mean for creating more equitable organizations.
As Minnesota continues to grow more diverse, the imperative for leadership that is reflective of and responsive to this diversity becomes even more critical. The data show we're moving in the right direction, but there's clearly more work ahead to ensure all Minnesotans have pathways to leadership roles that shape our communities.