Which of the thousands of charts on Minnesota Compass did users visit most in 2025? We crunched the numbers to bring you our greatest hits. Over the next several weeks, Wilder Research staff will break down our most popular bar charts, trend lines, maps, rankings, and tables—covering immigration, the workforce, and more—to reveal why these visuals are so important. Will your favorite chart make the list?
At-a-glance tables: Compass users interested in specific populations, including Minnesota’s disabled, Black, and older adult communities
Compass’s at-a-glance tables focus on specific populations and geographies. Their popularity reflects the wide range of communities of interest among data users, with each table offering unique insights into a specific population or place. Their popularity likely reflects the needs of service providers, community organizations, and policymakers who focus on these populations and their well-being.
Without further ado, your 2025 MN Compass table chart toppers: Minnesotans with disabilities, Minnesota’s older adult population, and Black Minnesotans.
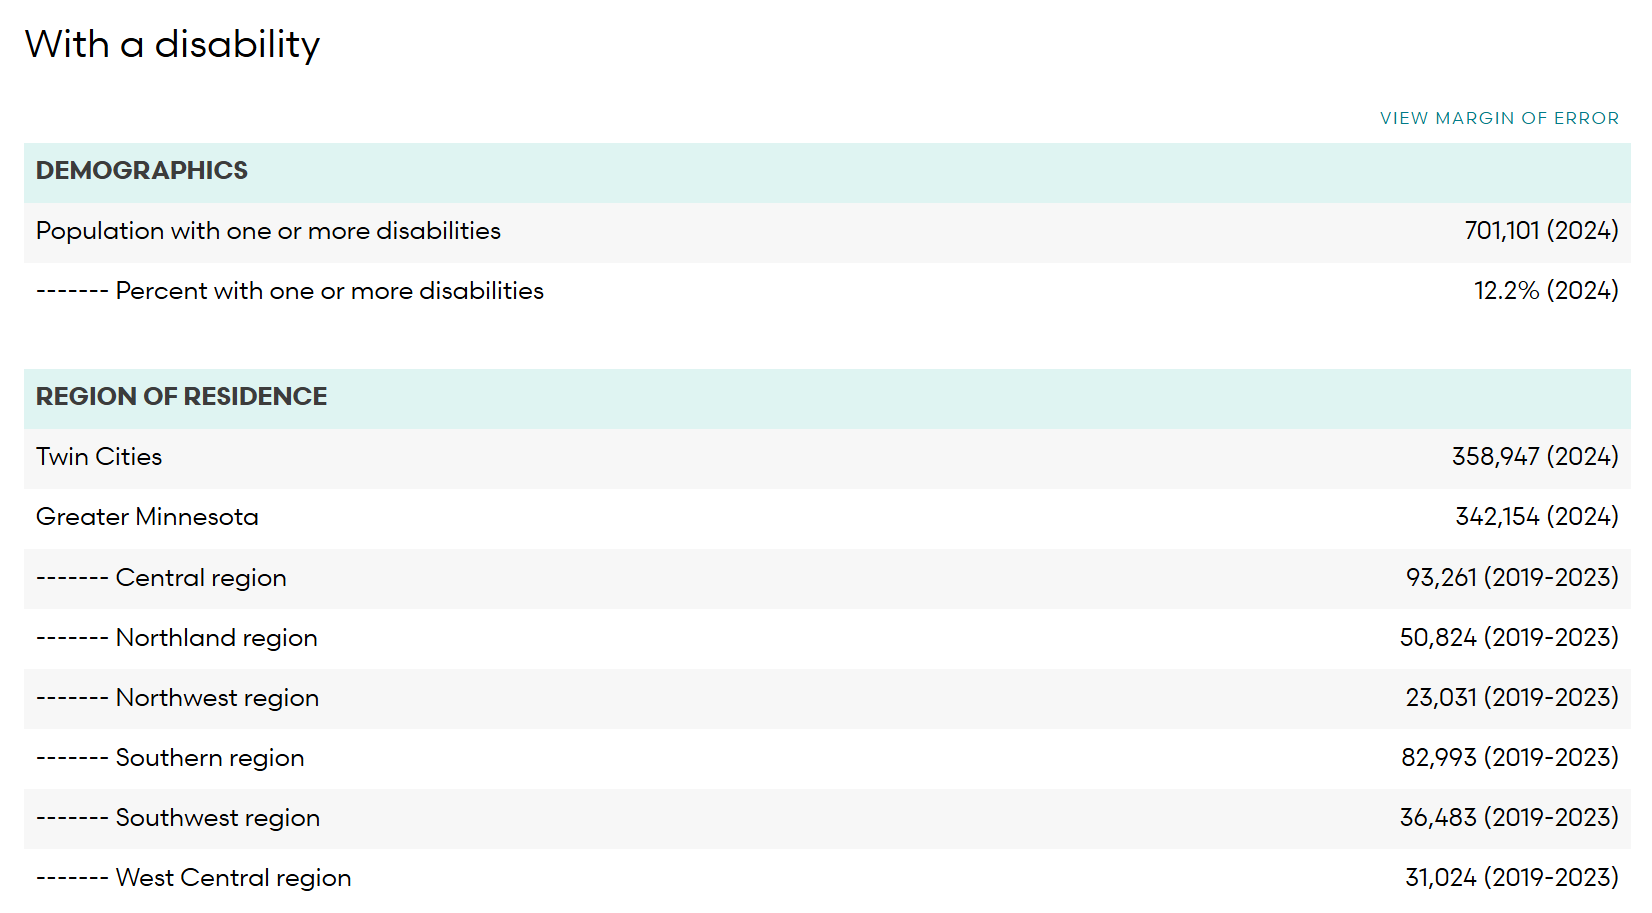
Minnesotans with disabilities
About 12% of Minnesotans report having one or more disabilities, which can include vision or hearing impairments, cognitive limitations, and challenges with mobility, self-care, or independent living. Disability status increases with age: 5% of kids, 10% of working-age adults, and 28% of older adults have a reported disability. Males and females have similar rates of disability, but disability status varies across racial groups, with American Indian Minnesotans reporting the highest rate of disability (17%) and Asian Minnesotans reporting the lowest (8%). Minnesotans living below poverty have a high rate of disability (27%), more than double that of the general population (12%).
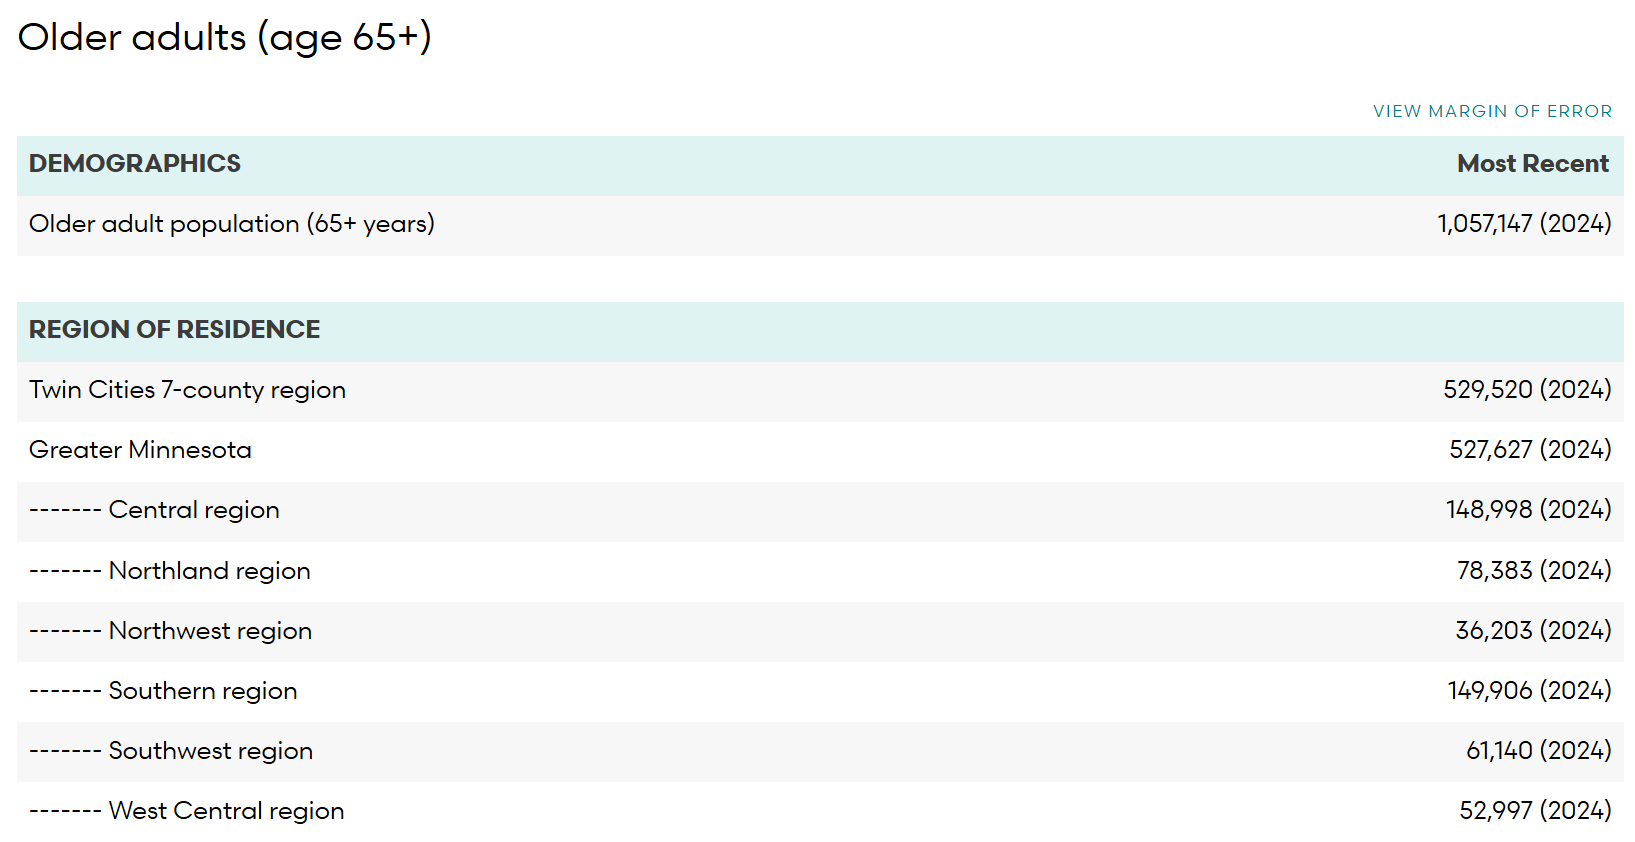
Minnesota's older adults (65+)
Older adults make up a substantial and growing proportion of Minnesotans: In the next 10 years, more than one in five Minnesotans will be an older adult. This at-a-glance table compiles data on the demographics and well-being of this population, illustrating a range of experiences of older adults. Roughly equal shares of older adults live in the Twin Cities and greater Minnesota. While older adulthood is associated with retirement, nearly 20% of older Minnesotans are employed. Incomes vary widely; 27% of older adult households make $100,000+ per year, while a similar proportion of households earn below $35,000 (28%), and 9% live below the federal poverty line (in 2024, $20,440 for a household of two). Nearly 28% of older adults report having one or more disabilities. The proportion of older adults without health insurance is extremely low (0.4%), largely due to Medicare coverage.
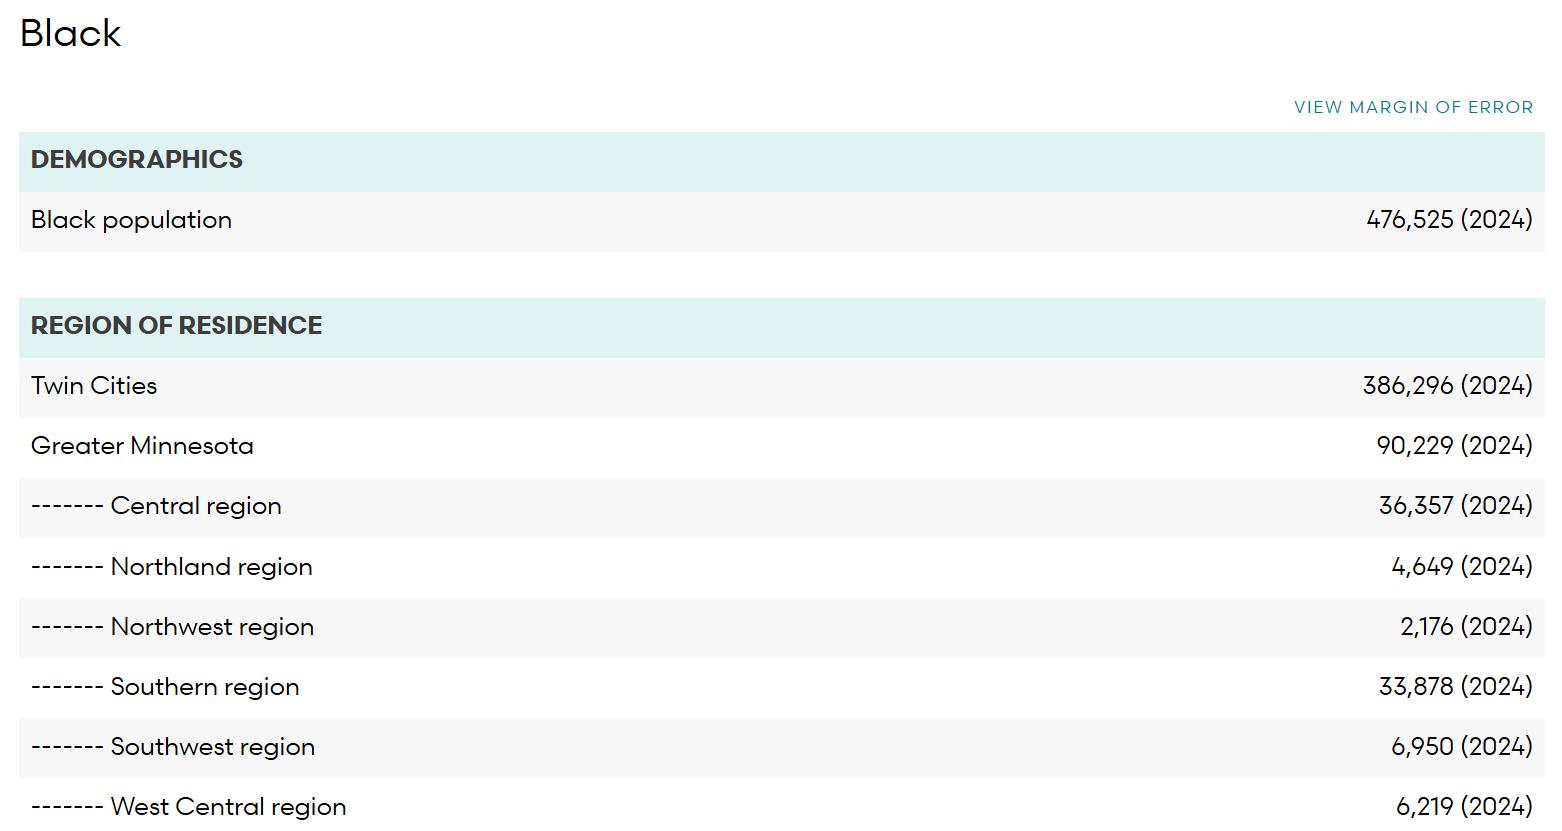
Black Minnesotans
As of 2024, nearly half a million Minnesotans identify as Black, with the majority living in the Twin Cities Metro area. Economic and housing gaps are substantial: One in five Black Minnesotans lives below the poverty line (20%), 10% lack health insurance, and 28% of Black-headed households own their homes. Educational barriers remain, with 45% of adults holding a high school degree or less, even as 70% of the working-age population is employed. About one in three Black Minnesotans was born outside of the U.S. (34%), underscoring the diversity of Minnesota's Black population and its global roots.
Interpreting the story behind these at-a-glance tables
While they may be less snazzy than maps and graphs, tables are a crucial chart type for conveying information. Tables on the Minnesota Compass website offer a more comprehensive portrait of Minnesota’s populations and geographies to inform grant proposals, strategic plans, and program design. For organizations seeking to understand who they serve and demonstrate community need, tables like these become indispensable resources. They not only provide a clear demographic and socioeconomic snapshot but also support evidence-based storytelling about disparities, progress, and areas for investment.