SECIA
Submitted by Stephanie Hankerson, community organizer
What were you aiming to do?
Minnesota Compass neighborhood data has been invaluable for my work as a community organizer. For example, we used the data in the work of the Southeast Como Improvement Association, which strives to maintain and enhance the physical, social and economic environment of the neighborhood. I found Compass described the observations we made of the Como neighborhood population but did not usually find in searches for census data.
Which information did you draw on?
Specifically in Southeast Como, we used the Compass data to understand more about the unusual bi-modal age distribution in our resident population. Nearly half of residents are age 18-24, compared to closer to 1 in 10 in Minneapolis as a whole.
We also picked up on the tremendously high annual turnover of new residents to the neighborhood.
What happened?
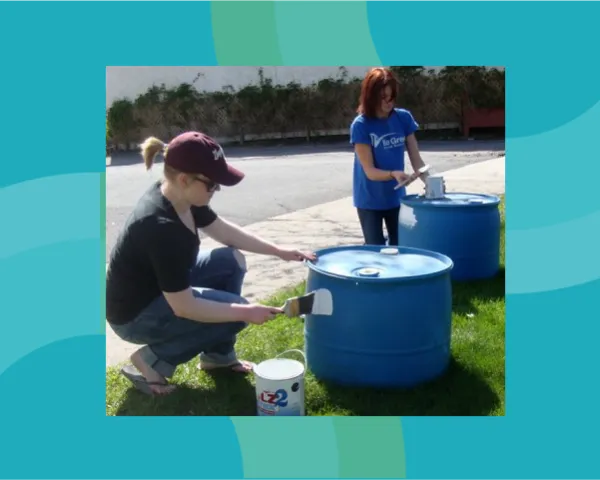
By understanding how divided in age the population of Southeast Como was, we were able to adapt programming and communications to fit both. For example, we developed inter-generational sustainability projects such at the MIMO (Move In/Move Out) Free Store, which both allowed older residents direct their surplus housewares to younger adults, and gave a low-cost option for new households to stock up.
The neighborhood association also developed a robust intern and college student volunteer program which significantly increased engagement of 20-year old residents in neighborhood volunteerism.