

In the types of data sources we use on Compass, information about Asian Minnesotans often includes anyone who self-identifies as Asian. These data can include a wide range of ancestries, birthplaces, and cultural identities. When unique cultural groups are grouped together under one common category like “Asian Minnesotans,” we can’t always identify and understand quality of life across distinct cultural groups. Therefore, this article highlights the importance of data disaggregation in understanding the varying lived experiences of Asian Minnesotans.
Minnesota’s Asian community is made up of many unique cultural communities.
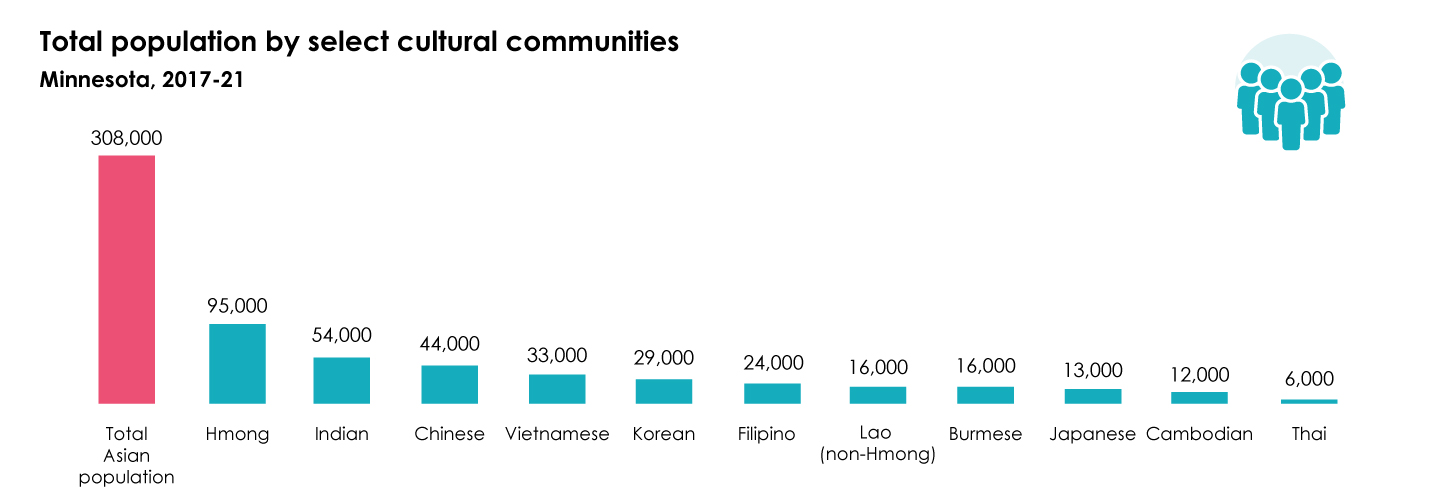
Minnesota is home to more than 307,000 Asian residents, making up 5% of Minnesota’s population and our state’s fourth largest racial group. But speaking about “Asian Minnesotans” glosses over a diverse set of cultural communities, including Minnesotans who identify as Burmese, Cambodian, Chinese, Filipino, Hmong, Indian, Japanese, Korean, Lao, Thai, and Vietnamese.
By the numbers, Hmong Minnesotans make up the largest Asian community, followed by Indian and Chinese Minnesotans.
We’ve said it previously in this article series and we’ll say it again: Experiences, strengths, challenges, and needs vary by community, which is why disaggregating populations beyond broad census-level race groups is so important.
Social, economic, and political context are critically important.
Quality of life outcomes differ across Minnesota’s Asian cultural communities, and these outcomes are often correlated with specific communities’ social, economic, and political history.
For example, thousands of refugees and asylees have resettled in Minnesota over the past five decades, many from Asian countries and cultures. The first wave of Hmong refugees arrived in Minnesota in the 1970s, followed by Vietnamese refugees in the 1980s. Karen residents, an ethnic minority largely from Burma, are one of the most recent refugee communities to arrive in substantial numbers in Minnesota starting in the early 2000s.
This article relies on data from the U.S. Census Bureau’s American Community Survey. Respondents indicating that they are Karen are recoded by the census into Burmese, with nothing to indicate their original response, although it is probably safe to assume that the majority of Burmese Minnesotans originally identified as Karen in their census forms.
Over the course of many decades, transnational adoption has also factored into Minnesota’s diverse Asian communities. Korean adoption to Minnesota began in the 1950s after U.S. involvement in the Korean War and, today, child adoptees from Korea continue to number in the thousands. There are also thousands of child adoptees from China currently living in Minnesota.
Finally, economic opportunity has shaped our Asian cultural communities in Minnesota. Historic records from the 1870s document the first Chinese immigrants to Minnesota, who established laundries and restaurants in what is now Minneapolis and Saint Paul. Today, thousands of employment-based visas are issued to Minnesota-based employers each year, with the largest employers including Optum Services, US Bank, Mayo Clinic, Medtronic, and the University of Minnesota. In recent years, nearly half of employment-based immigrant visas have been issued to workers from China and India.
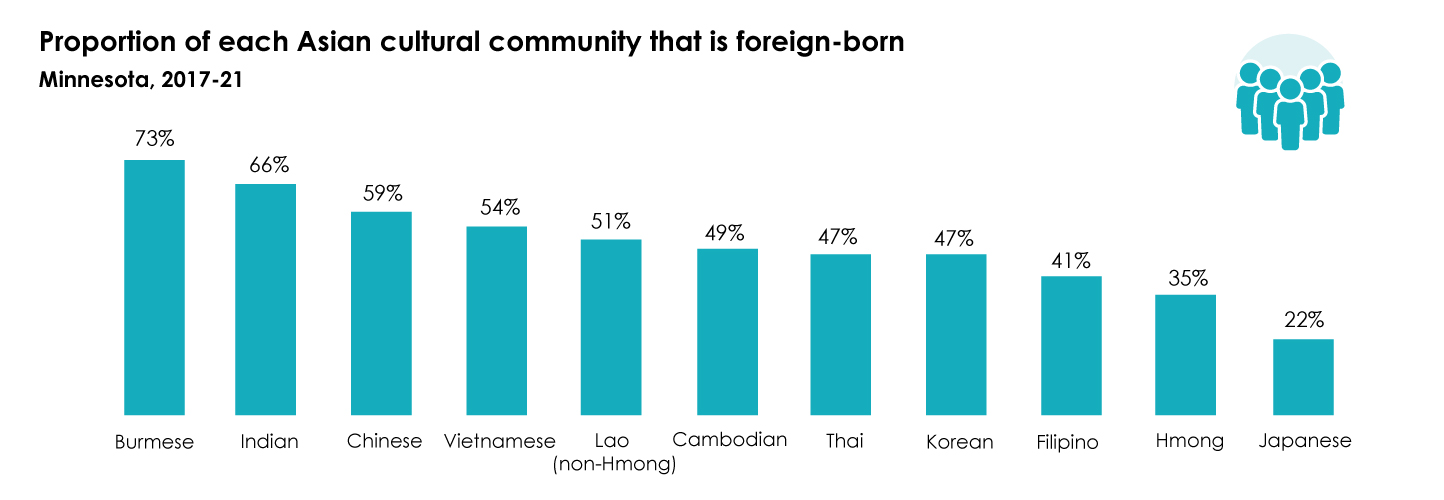
These social, economic, and political factors are reflected in the proportion of each Asian cultural community that is foreign born. Today, higher proportions of Burmese, Indian, and Chinese Minnesotans are foreign-born due, in large part, to political and economic circumstances bringing members of these unique cultural communities to Minnesota. On the other hand, after the largest waves of Hmong refugees arrived in Minnesota more than four decades ago, today’s Hmong Minnesotan community is largely native-born.
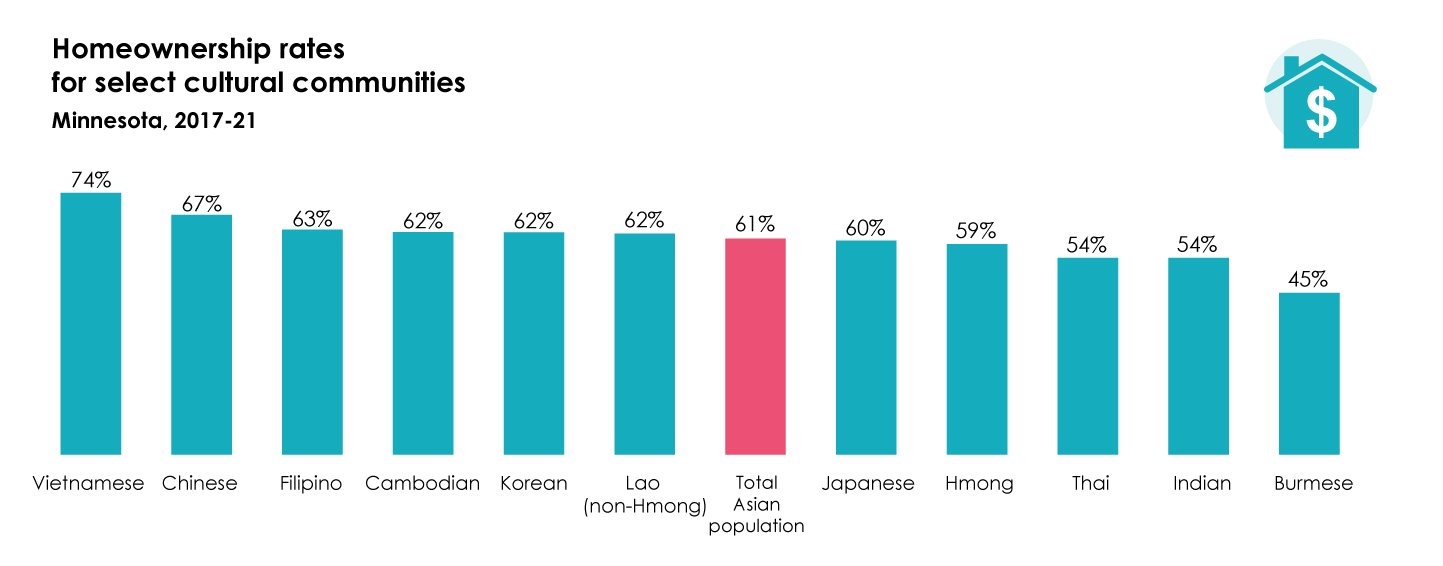
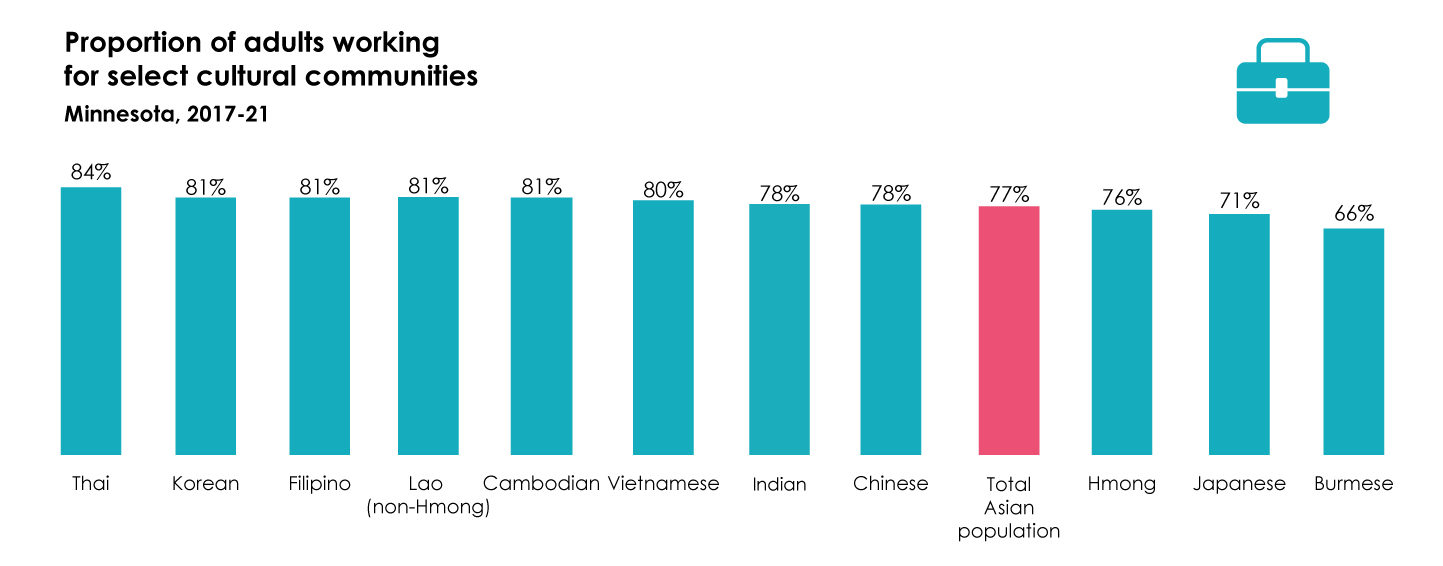
Quality of life outcomes differ widely across Minnesota’s Asian cultural communities.
Social, economic, and political context also help us better understand quality of life outcomes among Minnesota’s Asian cultural communities.
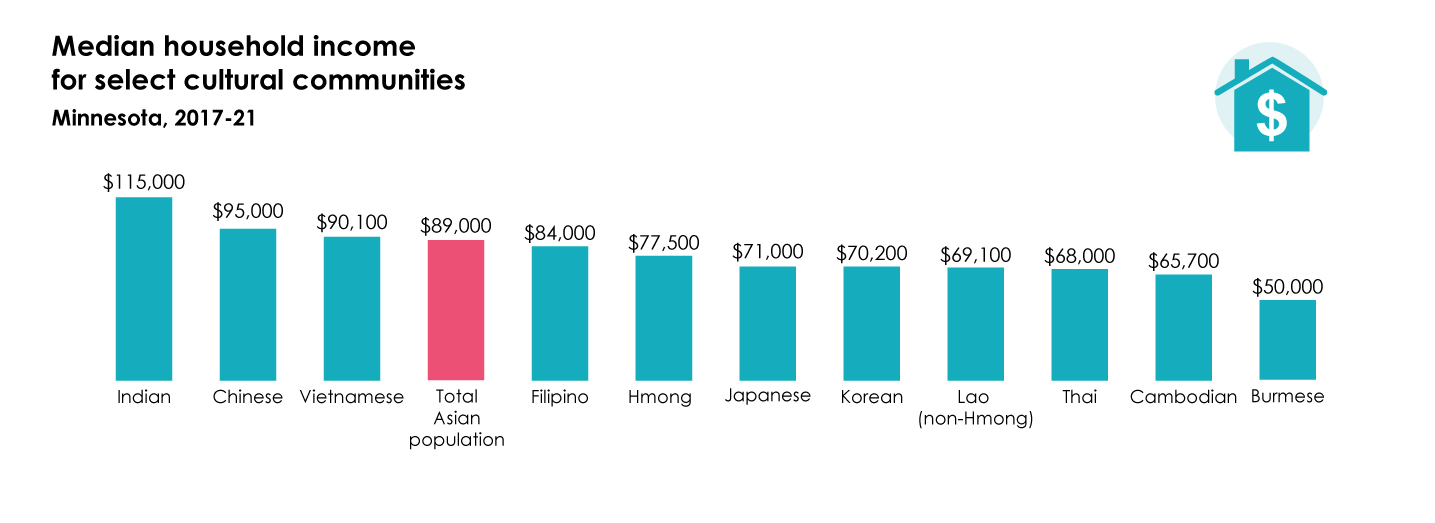
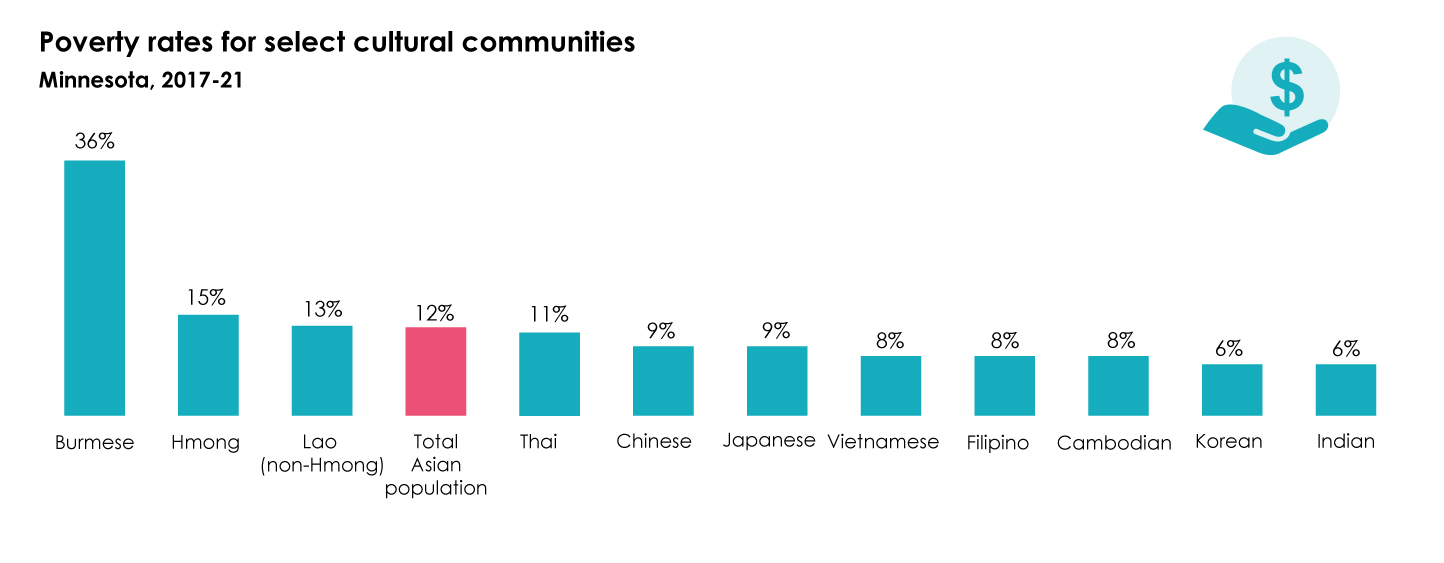
For example, we tend to see lower quality of life outcomes among Minnesota’s Burmese community, in large part as a result of the challenging circumstances under which many (but not all) from this cultural community arrived in Minnesota. Across Asian cultural communities, Burmese Minnesotans have the highest poverty rate and the lowest median household income, homeownership rate, and levels of employment.
One more time: Minnesota’s Asian community is made up of many unique cultural communities.
As we said in our previous article, no one data source—on its own—can tell the full story. We are talking about complex social issues that not only require information from multiple sources, but also rely on community wisdom to make meaning and identify necessary actions. In that spirit, here is a non-exhaustive list of organizations representing, working on behalf of, and telling the stories of broad and specific Asian cultural communities in Minnesota:
- Coalition of Asian American Leaders (CAAL): For more than 10 years, CAAL has sought to harness collective power to improve the lives of community by connecting, learning, and acting together. The organization has explicitly advocated for disaggregated data to create deeper understandings of the lived experiences of unique Asian communities. Their most recent research report, Redefining Wealth through Community and Cultural Assets, uses quantitative and qualitative data to provide a nuanced picture of Asian communities’ economic well-being.
- Council on Asian Pacific Minnesotans: The Council on Asian Pacific Minnesotans is an executive branch, non-cabinet agency tasked with the responsibility of working for the implementation of economic, social, legal, and political equality of Asian Pacific Minnesotans. Its primary customers are the Governor, the Legislature, state agencies, and Asian Pacific organizations and citizens.
- Chinese American Association of Minnesota (CAAM): Chinese American Association of Minnesota (CAAM) is the oldest and largest Chinese American community organization in Minnesota. It is non-profit and non-partisan with the mission to provide cultural, educational, recreational, and other programs to promote the cultural heritage and enhance the quality of life of Chinese Americans in Minnesota.
- Fil-Minnesotan Association (FMA): The Fil-Minnesotan Association is a non-profit organization dedicated to providing socio-civic, educational, cultural, and artistic opportunities to the Filipino Minnesotan community.
- Hmong American Partnership (HAP): HAP is a social service and community development nonprofit that serves nearly 30,000 individuals annually. Originally founded in 1990 to serve Minnesota’s growing Hmong population, it is now the largest Hmong-serving organization in the nation.
- India Association of Minnesota (IAM): IAM is a non-profit organization that aims to build a strong and cohesive community of over 50,000 Asian Indians in the state of Minnesota through its three-prong mission of culture, charity and connections.
- Japan American Society of Minnesota (JASM): JASM provides a place where both individuals and businesses are able to engage in cultural activities, meet others with an interest in Japan, form new business relationships, learn, and build mutual respect between Japan and America.
- Karen Organization of Minnesota: The Karen Organization of Minnesota is the first social services agency in the country founded by Karen refugees from Burma. They offer a variety of programs to help refugees transition to life in a new country and achieve their goals. They also provide resources to help organizations learn how to work with this growing community.
- Korean Institute of Minnesota: The Korean Institute of Minnesota provides knowledge, pride and understanding of Korea's culture and people; teaches the Korean language with the basis that being multilingual is desirable in our global society; and provides a resource center for people with links to Korea, their families, friends, educators and the community at large.
- Thai Association of Minnesota (ThaiAM): ThaiAM is a non-profit organization with a mission to promote the well-being of the Thai community, support members in the Thai community, and enhance Thai business and career growth.
- Thai Cultural Council of Minnesota: The Thai Cultural Council of Minnesota is a nonprofit organization that serves as a representative of authentic Thai cultures in Minnesota. It aims to promote Thai and Southeast Asian cultures through various events that teach about their rich traditions and to create a space for local Southeast Asian communities to meet and build unity.
- United Cambodian Association of Minnesota (UCAMN): The United Cambodian Association of Minnesota, Inc. (UCAM) is a non-profit, mutual assistance association dedicated to meeting the social service and other needs of the state's Cambodian immigrants and refugees. UCAM provides its clients with skills, tools, and knowledge necessary to achieve long-term economic independence and successful social integration into American society while fostering ethnic heritage and cultural preservation.
- Vietnamese Community of Minnesota: The mission of the Vietnamese Community of Minnesota is to preserve and enrich Vietnamese cultural heritage through educational initiatives; cooperate with other Vietnamese associations in unified actions for the better benefit of the Vietnamese community; and promote cross-cultural interactions and foster mutual understanding and cooperation between the Vietnamese community and other communities.
Did you know?
Minnesota Compass works directly with culturally specific organizations to provide disaggregated data profiles that can be embedded directly onto organizations’ websites. See, for example, a profile of Minnesota’s Hmong community on the Hmong American Partnership website. If your organization is interested in learning more, please contact us!
Additional resources
Recent updates and progress on data disaggregation
On March 28, 2024, the Office of Management and Budget (OMB) published revisions to Statistical Policy Directive No. 15, which sets minimum race categories for data on race and ethnicity for Federal statistics, program administrative reporting, and civil rights compliance reporting. The final recommendations include:
- Using one combined question for race and ethnicity (allowing Hispanic and Latino respondents to select this category solely, as preferred),
- Encouraging respondents to select as many options as apply to how they identify,
- Adding Middle Eastern or North African as a new minimum category, and
- Requiring the collection of additional detail beyond minimum request race and ethnicity categories to ensure further disaggregation when useful and appropriate.
This means that there are now seven minimum race categories (previously five): American Indian or Alaska Native, Asian, Black or African American, Hispanic or Latino, Middle Eastern or North African, Native Hawaiian or Other Pacific Islander, and White. Any additional (or disaggregated) categories must roll up to those seven groups. Agencies must comply with these new data collection standards by March 28, 2029.
OMB defines Asian as “Individuals with origins in any of the original peoples of Central or East Asia, Southeast Asia, or South Asia, including, for example, Chinese, Asian Indian, Filipino, Vietnamese, Korean, and Japanese.” Because this category combines all people who have Asian ancestry, it is important to disaggregate data by cultural community to reflect these communities back as they see themselves.