By Craig Helmstetter, Ph.D., former project director for Minnesota Compass
The deaths of Jamar Clark and now Philando Castile cause Minnesotans to again question our reputation as a highly educated, healthy, and progressive state that has a thriving economy and is a safe place to raise children.
Police shootings, as well as the dramatically low median income among Minnesota’s African American population surfaced by the latest Census Bureau data last fall, have broadened the concern. The elimination of racial and ethnic disparities is receiving more attention from the Governor's office to the Metropolitan Council to philanthropy and the state's leading businesses.
Even prior to these more recent flashpoints, there was a growing awareness of the embarrassing “Minnesota Paradox”: While our state ranks among the very best in overall quality of life, we also rank among the very worst in racial and ethnic disparities. Professionals in fields ranging from education and employment to health and housing – as well as grassroots advocates and the affected communities themselves – have been working hard to close gaps.
In other words, Minnesotans have been inspired into action (or embarrassed into action), at least in part by the inequity evident in the data. Compass tracks a number of key measures related to these topics, and nearly all continue to show stubbornly large racial gaps.
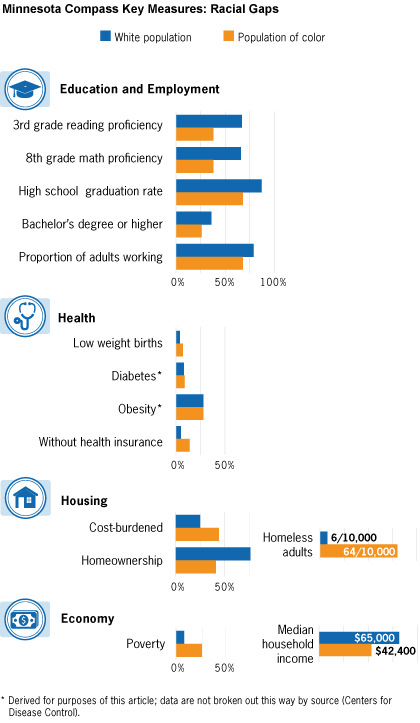
Data for these key measures are the most recent available. View the data and notes
Even among the two measures where there are no white-of color disparities overall, obesity and diabetes, rates are high among the state’s black and Hispanic populations.
Are we making progress?
While raising awareness and moving to action are important, it is also important to track progress to see if efforts are paying off. Where are disparities more and less acute? More specifically, are we seeing conditions improve for Minnesotans of color? Let’s take a look.
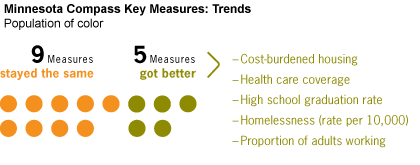
The good news is that we see improvement in 5 of the measures. The bad news is that despite a lot of serious efforts to address racial disparities, conditions for people of color appear stuck in 9 measures. Perhaps efforts in these areas are working but not yet bearing fruit, perhaps the long hang-over from the great recession is still masking some of the change that has taken place, or perhaps our data sources are not sensitive enough to detect change (either positive or negative) that may be happening.
Do gaps appear worse because Minnesota’s white population is doing so well?
One way to explore that question is to compare how populations of color are doing here compared with populations of color in other states.
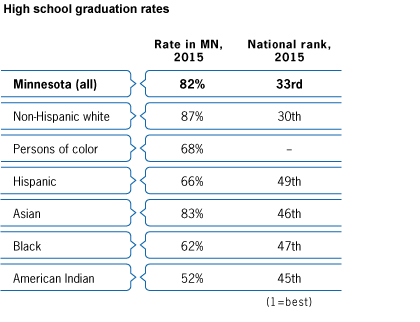
For the past few years we have been able to compare the high school graduation rates among the states. While these comparisons are not precisely apples-to-apples due to variation in high school diploma standards (Minnesota’s are relatively more difficult), the results of comparisons are still shocking.
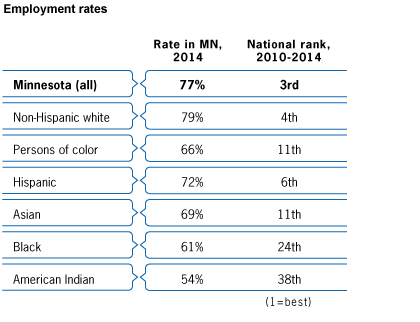
Similarly, we recently updated employment data by race which show some progress on the relative employment rates of Minnesotans of color compared with those in other states. Overall, employment among Minnesota’s population of color ranks a not-too-shabby 11th place, and Minnesota’s Hispanic population ranks 6th.
Unfortunately, rankings don’t look nearly as good for Minnesota’s black and American Indian populations. And, if we return to the question of gaps between white and of color populations, things look even worse. Even the relatively small 7 percentage point gap between Minnesota’s white and Hispanic population is among the widest in the nation, ranking 37th. The gaps between white populations and other populations of color, are even larger and remain among the widest in the nation.
So what works?
Addressing disparities, and promoting the greater well-being and prosperity of Minnesotans of color, is an extremely complex issue touching on everything from what works best in child rearing and education to the elimination of segregation and institutional racism.
The Compass key measure showing the most dramatic improvement among Minnesotans of color, health care coverage, suggests that major acts by the federal government may be required. The Central Corridor Tracker showed that it is possible to set and achieve goals for hiring people of color. Other research has shown the crucial role that reinforcing cultural identity can play in educational and health outcomes for children and youth.
Addressing disparities also requires greater disaggregation of data. We have taken some steps in this direction. For example, while we know that the overall proportion of black workers in Minnesota with paid employment is 61 percent, we also know that this differs by nativity, with the rate among foreign-born black workers surprisingly higher (68%, ranked 34th in the nation) than the rate for black workers born in the U.S. (57%, ranked 36th). Data disaggregation like this can allow greater targeting of scarce resources and more culturally appropriate interventions. Watch for more progress from us (and others) on data disaggregation in months to come.
Finally, we welcome your thoughts on what works best. We are always looking for evidence-based, as well as promising, solutions from all sectors and all sides of the aisle. As our state’s populations of color continue to drive population growth, addressing disparities has moved beyond an issue of social justice to a real imperative, important for the prosperity of all Minnesotans and quality of life throughout the state.