The U.S. Census Bureau released its annual American Community Survey data recently, including official poverty estimates. While not a perfect measure, it is indexed for household size ($12,071 for a single-person household and $24,230 for a family of 4) and gives us some guidance about levels of poverty and those who are among our poorest residents.
Former Minnesota Compass Project Director Craig Helmstetter uses information from the estimates to bust some commonly-accepted myths.
Myth #1: Minnesota’s economy has fully recovered and poverty rates are back down to pre-recession levels
By 2013 Minnesota had recovered the number of jobs lost during the Great Recession – but the economy has not fully recovered by other measures. Minnesota’s official poverty rate now stands at 11.5 percent.
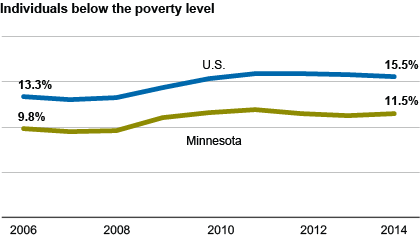
While this is statistically lower than the recent high of 11.9 percent (2011), it has yet to return to the 9.5 percent that we saw just prior to the recession in 2007. With well over 600,000 Minnesotans living in poverty today, there are over 100,000 more people in poverty today than would be the case if we were back to the pre-recession normal.
Two other 2014 data points also suggest that Minnesota’s economy has not yet fully recovered: both the proportion of adults working (77.3%) and the median income ($61,481) remain slightly lower than they were prior to the recession (78.6% and $63,716 in constant dollars). While we would like to be doing better on all three of these measures, Minnesota is out-performing the nation, both in terms of current status and the strengthening of the economy.
Myth #2: Sure, there are racial disparities here, but they are not nearly as bad as elsewhere in the nation
Poverty rates remain as yet another example of the “Minnesota paradox:” as a state we are better off than the rest of the nation, but too often this relative good fortune has not extended to Minnesota’s populations of color. In fact, Minnesota is home to some of the worst racial disparities in the nation. Minnesota’s poverty rate for persons of color is statistically higher than the national average (26% compared to 23%), while our poverty rate for non-Hispanic whites is statistically lower (8% compared to 11%).
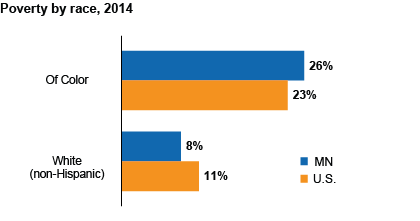
Poverty rates are especially high among certain groups including African Americans (38%), American Indians (32%), and Hispanics (23%). Looking at specific racial and ethnic groups, only African Americans are statistically higher than the nation as a whole; Minnesota’s poverty rate for African Americans is now 11 percentage points higher than the national rate for African Americans.
Myth #3: Most single mothers live in poverty
Contrary to at least some stereotypes, a sizeable majority of single mother households in Minnesota have incomes above the federal poverty line. That is not to say, however, that poverty rates are not high among single parent households. The poverty rate is 16 percent for families headed by a single father and 36 percent for families headed by a single mother. On the other hand, the poverty rate among married couples with children is only 5 percent.
Similarly, the latest data once again show big variation in median household income, depending on type of household in Minnesota.
Myth #4: No one is poor in the suburbs
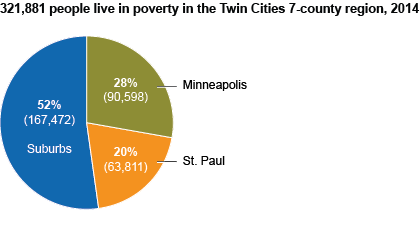
The suburban poor have outnumbered those in poverty in the central cities for at least half a decade. In the 7-county region, 2014 data show 167,472 suburbanites in poverty, compared with 154,409 in the central cities of Minneapolis (90,598) and St. Paul (63,811).
There are, of course, also far too many in poverty in Minnesota’s other 80 counties; that number has now reached 289,473.
While these numbers are important, they don’t tell the whole story. Poverty remains much more concentrated in the central cities than the suburbs, with rates of 23 and 22 percent in Minneapolis and St. Paul, compared with 7.4 percent in the suburbs overall.
Even that fails to tell the whole story, however. Earlier data show poverty rates well over the statewide average in several Twin Cities suburbs, and well under in some central-city neighborhoods. Similarly, while the overall rate is 12 percent in Greater Minnesota, county-level rates vary from 7 to 24 percent.
Myth #5: Minnesotans wouldn’t allow people with disabilities to live in poverty
In Minnesota, poverty rates are twice as high for those with disabilities as they are for those without (21% and 10%, respectively). Looked at another way: 1 in 10 Minnesotans has a broadly-defined disabling condition; the same can be said of 1 in 5 Minnesotans in poverty.
Myth #6: Between college debt and a changing job market, a bachelor’s degree no longer pays
For most Minnesotans a college degree still pays, at least in terms of avoiding poverty. The poverty rate has remained relatively low – below 4 percent – and largely unchanged for Minnesota adults with at least a bachelor’s degree for the past several years. The economy has been harsher for Minnesotans without a bachelor’s degree. The poverty rate for that group was just below 10 percent through 2008; it then grew to a high of 11.6 percent in 2011 and has basically stayed at that level since that time.
What has changed over that time, however, is the proportion of Minnesotan adults who have attained a bachelor’s. That percentage has steadily grown, with about a half percentage point gain in each of the past several years. Already by 2012, over one-third of Minnesota’s adult population had provided themselves a buffer against poverty by completing a bachelor’s degree, including nearly 40 percent of those age 25-34.
PS. ACS? CPS? Supplemental? Why so many data sources?
For the past several years the Census Bureau has released two official poverty rates, one based on the Current Population Survey (CPS; released on September 17th this year) and the other based on the American Community Survey (ACS; September 19th). The two sources provide similar national estimates; the U.S. poverty rate is 14.8 percent according to the CPS and 15.5 percent according to the ACS.
In addition, for the past four years, the Census Bureau has released a “Supplemental” measure of poverty. The 2014 Supplemental measure once again showed a similar overall national poverty rate (15.3%), but results in a lower rate for children (16.7% nationally compared with 21.5% according to the CPS) and a higher rate for those age 65 or older (14.4% compared with 10.0%). The difference comes from the improved methodology of the Supplemental measure including adjustments for regional cost-of-living variations, adding governmental assistance programs into income, and taking away expenses related to work and health care. However, the measure is much more complex to calculate, currently is still considered experimental, and is only available at the state-level.
At Minnesota Compass, we rely most heavily on the ACS since it is more robust at the state and lower levels. For example, the ACS estimates are based on surveying about 70,000 people in Minnesota annually, whereas the CPS estimates are based on surveying a similar number nationally. ACS data allows us to present demographic analyses, metro-level comparisons, as well as comparable data for cities and towns. Most of the city level data we rely on comes out in the 5-year ACS estimates, scheduled for release in December. Stay tuned!
Craig Helmstetter is the former director of the Compass project..