Note: Since this article was published in 2018, much has changed about race data collection in the U.S. See a list of newer Insights articles at the end of this article.
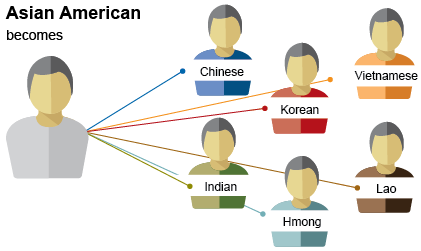
"Data disaggregation" means splitting large, general categories into more specific groups. When we are talking about race data disaggregation, for example, Asian Americans can be divided into cultural groups such as Hmong, Vietnamese, Lao, Chinese, Korean, etc. Similarly, American Indians can be divided by tribal affiliation, such as Ojibwe, Dakota, Lakota, Ho-Chunk, etc. We can do this for any major racial or ethnic group in the U.S.
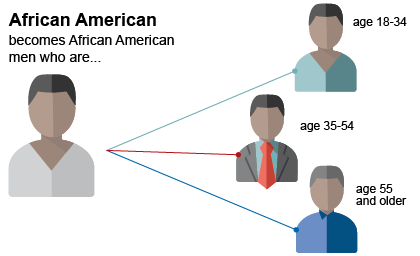
Data disaggregation can also be used to further subdivide large race/ethnic groups. For example, we can separate African Americans into gender and/or age categories, which we can report in a few broad groupings, or divide into several narrow ranges, depending on the purpose.
And, of course, we can use disaggregation to provide important nuance to our descriptions of a population. For example, the Census category "Black or African American" could be divided into African Americans and African-born Blacks, which is an important distinction in communities with large African-born immigrant groups.
We could also divide racial or ethnic groups by gender, disability or health insurance status, language spoken at home, zip code of residence, etc. The possibilities are almost limitless! However, not all are useful or meaningful…
Why should we disaggregate race data?
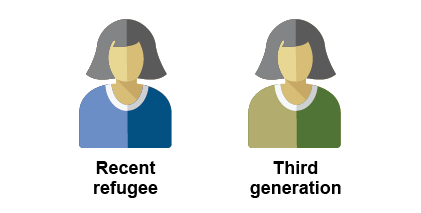
We (social scientists, policy makers, advocates, service providers) frequently need more information than race to help understand the strengths, needs, and quality of life of diverse groups in our communities and the differences and disparities among those groups. Careful data disaggregation can increase our clarity about a particular question or issue. For example, if all we know about a person is that they are "Asian American" that won't help us understand very much about their health status, health needs and behaviors, and likely health outcomes. Instead, if we know that someone is a third-generation Hmong Minnesotan or a newly arrived Karen refugee, and we know whether they have health insurance or not, we get a fuller picture about how to support them in being healthy.
Race is a social construct, not a biological fact. This is reflected in the ways that the U.S. Census Bureau and other entities have changed how they measure race over time. In the first census in 1790, the only races were "free whites," "all other free persons," and "slaves." Currently, the U.S. Census Bureau asks people to identify whether they are of Hispanic, Latino, or Spanish origin, followed by a separate question asking people to identify with one or more racial groups. In data tables published by the Census, racial identification is often grouped into five categories: American Indian or Alaska Native, Asian or Pacific Islander, Black or African American, White, two or more races, and some other race.
Since race is socially constructed, we can change the ways we measure it (and other sociodemographic variables) to ensure that what we measure is meaningful. In other words, we want to know what variables actually help us understand how someone might access or experience a service, what types of outcomes we might expect to see from their participation in a program, and/or what types of resilience or assets they might have to help them cope in different situations.
How to disaggregate?
In order to learn more about which sociodemographic variables are meaningful to understand any given situation, a good researcher will do the following:
- Determine an appropriate and feasible scope. Will the extra effort required to accurately gather more nuanced data actually help you to answer your key questions? Make sure the categories and sub-categories you use align with what you want to explain or understand.
- Make sure people feel safe! We acknowledge the difficult political climate in which people may feel unsafe to disclose information about their ethnic origins, immigration status, and related topics. In addition, this fear among certain groups about disclosing their information is related to their fear of accessing services they need, which contributes to even greater disparities and worse health outcomes among these groups.
- Consider historical context and intersectionality, which refers to the interaction of multiple identities. (For example, it may not be enough to understand the experience of being a woman without further considering how womanhood is experienced differently by race, ethnicity, nativity, class, sexual orientation, or other identities.) We accomplish this, in part, by using culturally relevant methods and doing our background research. Minnesota Compass is one source of background information you can use to get a better sense of a community before you dive in to your new research project.
- Use both qualitative and quantitative data and seek out information from multiple sources when trying to unpack complex social issues. One source of data rarely tells us enough about an individual or group experience to make major decisions. This includes incorporating the perspectives of those who are directly affected by the issue, as they are the experts about their own circumstances and experiences.
- Similarly, involve community members in interpreting data. Determine how to disaggregate by getting input from people who are directly affected by the issue. Involving community members in interpreting data, making meaning, and generating recommendations are critical steps to getting disaggregation right.
Current trends in race data disaggregation
The U.S. Census Bureau was discussing several useful moves toward more disaggregation for the 2020 Census. The proposed changes included combining the Hispanic ethnicity and race questions (for people who are Hispanic and who do not identify with any other major racial group), and adding a new racial category of Middle Eastern and North African (people who have ancestry from that region of the world are currently classified as "white" by the Census Bureau).
Unfortunately, on January 26, 2018, the Census Bureau announced that they would not make these changes for the 2018 Census Test or for the 2020 decennial Census, despite the very positive feedback they received during preliminary testing of these new question formats. The 2020 Census will instead use the 2010 Census format for race and ethnicity questions, with a few minor updates. This means that 2020 data on race and ethnicity will be limited to the same categories as 2010.
Next steps toward better disaggregation to support informed decisions
While there is currently little prospect for the 2020 Census to include more detailed or relevant racial and ethnic categories and sub-categories beyond those used in 2010, all of us can advocate within our own organizations and at all levels of government for better data gathering and appropriate data disaggregation to inform program design and delivery and policy-making.
Want more information?
Check out this 10-minute narrated PowerPoint presentation, which contains slides and narrative from Nicole's remarks during the 2018 Minnesota Compass Annual Meeting.
2022 UPDATE: Minnesota Compass now provides detailed information for 27 of the largest cultural communities in Minnesota, including our Chinese, Dakota, Ecuadorian, Ethiopian, Filipino, Hmong, Indian, Korean, Lao, Liberian, Mexican, Ojibwe, Puerto Rican, Somali, and Vietnamese communities.
Related
Why aren't a represented on Minnesota Compass? Our mncompass.org users frequently ask Compass staff if they can get more data on a specific demographic group not represented on our website. Research Associate Anne Li shares three things to know about our demographic data and why it can be difficult to retrieve specific data.
This timeline from Pew Research Center shows different race, ethnicity, and origin categories used in the U.S. decennial census between 1790 and 2020. Pew has also developed an interactive tool that allows you to compare categories used in two decennial census years, side-by-side.
Newsweek: There Is No Such Thing As Race illustrates that while the vast majority of scientists agree that there is no biological basis for race, it is still used as an argument to support or justify racial disparities in educational outcomes and other important social inequalities. The author, who also wrote an extensive volume on the topic, describes the history of how the idea of race developed and how the conception of race has changed over time.
National Geographic: Black And White: The Race Issue is an example of a major publication acknowledging its role in shaping how race is defined and understood (link to article summaries only; subscription required for full access).