Minnesota population at a glance | Minnesota's quality of life indicators
How racially and ethnically diverse is our state?
Our mncompass.org web analytics show that users are visiting key sections to learn more about the racial and ethnic makeup of Minnesota's population. Our data by race and ethnicity, by immigrant group, and by cultural community can help paint a clearer picture of who we are as a population, where we live and work, and what is impacting our quality of life. Here is a snapshot of facts about some of the people who make Minnesota their home.
Race and ethnicity
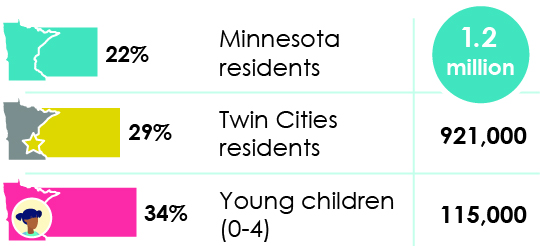
Minnesota’s population is becoming more racially and ethnically diverse, especially among our younger age groups.
Black, Indigenous, and people of color (BIPOC) make up:
Immigrant group
Immigrants contribute to the growth of the state’s economy and population.
- About 8% of the state’s population is foreign-born.
- 75% of foreign-born residents are working.
- 20% of kids in Minnesota are children with an immigrant parent.
- Mexican immigrants are Minnesota’s largest immigrant group.
Cultural community
Minnesota is home to many cultures, and our demographic profiles on 27 of the largest cultural communities provide insight into our quality of life.
- More than half of Somali residents are age 17 and younger.
- More than 9 in 10 Hmong Minnesotans live in the Twin Cities.
- Nearly 4 in 10 Mexican Minnesotans live outside of the Twin Cities.
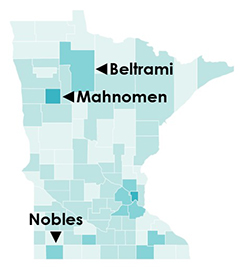
- Three of the five most racially and ethnically diverse counties in Minnesota are in greater Minnesota: Mahnomen: 63%, Nobles: 59%, and Beltrami: 46% (Percentages denote the probability two people selected at random would be from different racial and ethnic groups)
"Why aren't I represented in Compass data?" Learn why some specific demographic data are hard to retrieve.
Minnesota's population at a glance
| 2000 | 2021 | |
|---|---|---|
| Overall population | 4.9 million | 5.7 million |
| Twin Cities | 2.6 million | 3.2 million |
| Greater Minnesota | 2.3 million | 2.6 million |
| Children and youth (age 0-17) | 1.3 million | 1.3 million |
| Twin Cities | 698,000 | 730,000 |
| Greater Minnesota | 589,000 | 587,000 |
| Working-age residents (age 18-64) | 3.0 million | 3.4 million |
| Twin Cities | 1.7 million | 2.0 million |
| Greater Minnesota | 1.3 million | 1.5 million |
| Older adults (age 65+) | 594.000 | 956,000 |
| Twin Cities | 255,000 | 472,000 |
| Greater Minnesota | 339,000 | 472,000 |
| Foreign-born residents | 260,000 | 487,000 |
| Twin Cities | 206,000 | 387,000 |
| Greater Minnesota | 54,000 | 101,000 |
| People of color | 582,000 | 1.2 million |
| Twin Cities | 444,000 | 921,000 |
| Greater Minnesota | 138,000 | 328,000 |
Numbers may not add up to totals due to rounding.
Minnesota's quality of life indicators
Arts & Culture
Adults age 18+ who attended a cultural event in the past year
Adults age 18+ who created or performed art in the past year
Students participating in artistic lessons at least once a week
Children & Youth
Students who are connected to a caring adult
Students participating in enrichment activities three times a week
Civic Engagement
Voted in 2022 mid-term election (voting-eligible)
Residents age 16+ who volunteer
Adult neighbors who help neighbors
Early Childhood
Children screened before age 5
Low-weight births
Economy
Per-capita GDP (2012 chained dollars)
Number of jobs
Median household income (2021 dollars)
Poverty rate
Education
3rd-graders who are proficient in reading
8th-graders who are proficient in math
Students who graduate high school on time
Environment
Days air quality was rated "good" (Twin Cities)
Tons of greenhouse gas emissions per person
Health
Adults age 18+ who are obese
Residents under age 65 who are uninsured
Adults age 18+ with diabetes
Housing
People experiencing homelessness
Households who pay 30% or more of income for housing
Homeownership gap (white, of color)
Public Safety
Serious crimes committed per 1,000 residents
Traffic injuries and fatalities per 100,000 residents
Transportation
Highway miles rated in poor condition
Household income spent on transportation (Twin Cities)
Annual hours of delay per auto commuter (Twin Cities)
Average number of jobs reachable within a 30-minute commute by foot or transit (Twin Cities)
Workforce
Proportion of adults working
Adults age 25+ with a bachelor’s degree
Graduation rate at 4-year institutions (within 6 years)
Graduation + transfer rate at 2-year institutions (within 3 years)