For Minnesota to be its best, we need talented leaders from all backgrounds to make our institutions work well for all.

what we have learned so far
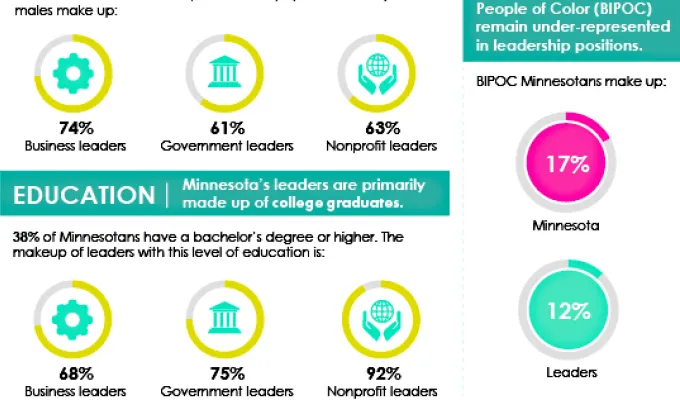
Three in ten leaders in Minnesota are women. Given that half of all Minnesota adults are women, we would need to see close to twice as many women in positions of leadership in order to reach parity.
The share of women who are leaders has increased incrementally over the last 15 years – from 22% to 29% – and this increase has been led almost entirely by trends in the business sector. Still, across sectors, women’s representation in business leadership lags behind their representation in nonprofit and government leadership.

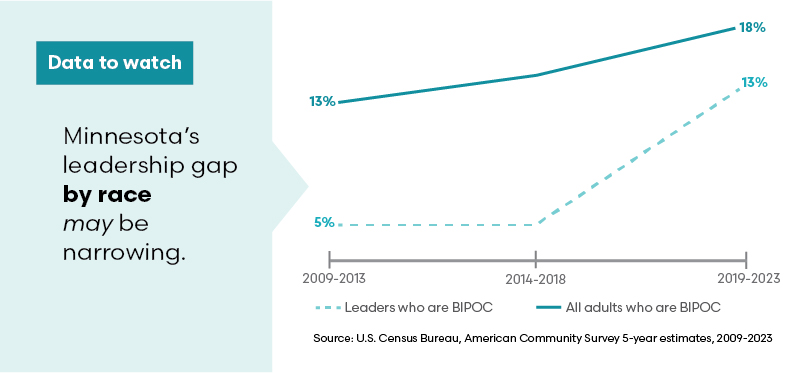
Thirteen percent of Minnesota’s leaders are Black, Indigenous, or People of Color (BIPOC), compared to 18% of all Minnesotans. That’s a five percentage point gap to reach representative parity among leaders. Ten years ago, that gap stood at about eight percentage points. It is too soon to say we are seeing a larger shift toward representative leadership by race, but the trend may be starting to point in that direction.
Government leaders in Minnesota tend to “look like” the people they employ and serve across multiple characteristics, including race, gender, and disability status. The government sector faces its own challenges, sitting at a particularly critical point in needing to transition leadership to younger generations. But it may also be true that the government sector has been able to shift more nimbly with demographic shifts because leaders are elected by the people they employ and serve.
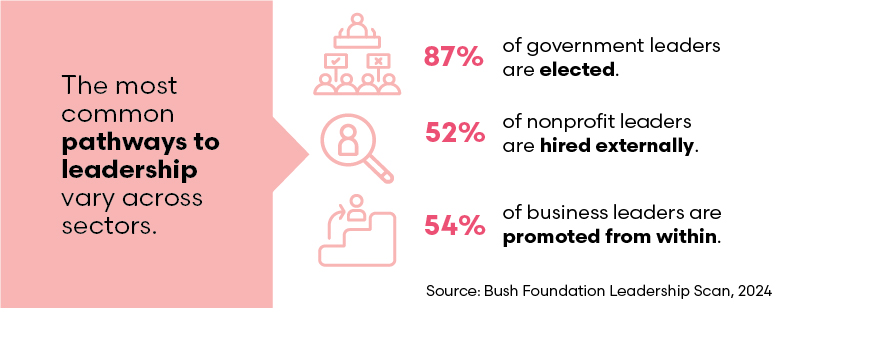
In fact, in our survey of government leaders, 87 percent had been elected into their positions. The most common pathway to leadership in the nonprofit sector was external hire (52% of nonprofit leaders), while the most common pathway to leadership in the business sector was promotion from within (54% of business leaders). Compared to the election process, these latter pathways to leadership may have unique barriers that keep qualified adults from leadership positions. Our Leadership Toolkit has several useful tips for what can help bolster diversity, equity, and inclusion in hiring and promotions.
Media requests
Sheri Booms Holm
Senior Communications Specialist
651-280-2739
sheri.holm@wilder.org
 Analyzing census data
Minnesota Compass researchers analyzed data from the U.S. Census Bureau's American Community Survey to provide estimates of the number of top executives and elected leaders in Minnesota by gender, race, age, education, wage level, disability, veteran status, and more.
Leaders at a glance
Leaders by demographics
Age Race Gender Nativity Educational attainment wage level veteran status disability status geographic region
![]()
 Surveying local leaders to learn more
Because the national census data is incomplete in many areas, Wilder Research partnered with League of Minnesota Cities, Minnesota Chamber of Commerce, and Minnesota Council of Nonprofits to collect and analyze detailed data on the characteristics of leaders in local government, nonprofits, and businesses across the state.
Leaders by demographics
Age Race Gender Educational attainment Career path VETERAN STATUS disability status geographic region Sexual orientation
Inspiration and resources to spark change
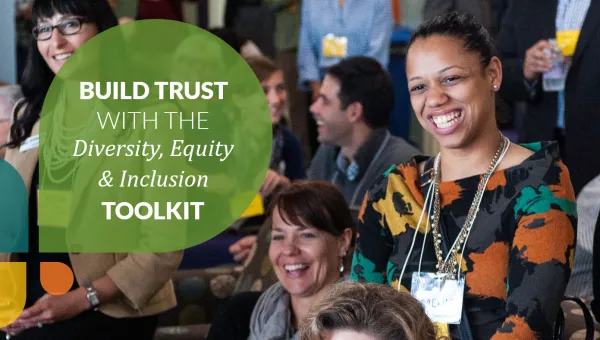
Learn how organizations and communities are championing diverse and inclusive leadership, and explore our leadership resources.




Minnesota Compass and the Bush Foundation teamed up to provide a holistic picture of institutional leadership in our state and how our institutions are developing the talent Minnesota needs.
Demographic data on who holds leadership positions in business, government, and nonprofits in Minnesota have not been readily available or easily accessible, nor has information about what is helping foster more equitable and inclusive leadership.
Understand who leads:
We will research Minnesota’s leaders in the business, government and nonprofit sectors.
share promising practices:
We will uncover how sectors develop the talent Minnesota needs.
spark change:
We aim to inspire employers to foster more equitable and inclusive leadership.
Measure progress:
We will track leadership data on a regular basis.
Minnesota Compass analysis uses data from the Integrated Public Use Microdata Series (IPUMS-USA), which collects and harmonizes U.S. Census Bureau American Community Survey (ACS) data. The ACS includes demographic characteristics (age, race, nativity) and workforce information (occupation, employment status, wages, sector). Estimates are based on five-year data collection periods.
Leadership Definition: Leaders are defined as currently employed individuals whose primary occupations are classified by the Census Bureau as "Chief executives and legislators." Occupation data comes from self-reported, open-ended responses to "What was this person's main occupation?" which are then recoded by the Census Bureau into standard occupation categories.
Sector Classification: Leadership data is categorized into three sectors based on self-reported employment type. Government sector includes local, state, federal civilian, and military employees. Nonprofit sector includes tax-exempt and charitable organizations. For-profit sector combines both private company employees and self-employed workers (incorporated and non-incorporated business owners, professional practices, and farms).
Data Limitations: Some high-level leaders may describe their occupation in ways that don't get coded into the "Chief executives and legislators" category. All occupation and sector classifications rely on self-reported survey responses from ACS participants. The number of leaders by sector may not match organizational counts from other sources like the Quarterly Census of Employment and Wages (QCEW) because ACS provides sample-based estimates while QCEW provides census counts, and because large organizations may have multiple leaders while smaller organizations may have leaders who don't identify as "executives.”
Citation: Steven Ruggles, Sarah Flood, Matthew Sobek, Daniel Backman, Grace Cooper, Julia A. Rivera Drew, Stephanie Richards, Renae Rodgers, Jonathan Schroeder, and Kari C.W. Williams. IPUMS USA: Version 16.0 [dataset]. Minneapolis, MN: IPUMS, 2025. https://doi.org/10.18128/D010.V16.0
Technical Note: Complete occupation codes are available at https://usa.ipums.org/usa/volii/occ2018.shtml
Wilder Research and Bush Foundation partnered with the Minnesota Chamber of Commerce to survey business leaders and partnered with the League of Minnesota Cities to survey government leaders.
The survey of business leaders was open from November 21, 2024 - January 31, 2025. Of the 11,000 business leaders invited to complete the survey, 34 responded, for a response rate of 0.3%.
The survey of government leaders was open from September 18 - November 5, 2024. Of the 3,368 government leaders invited to complete the survey, 599 responded, for a response rate of 18%.
Wilder Research and Bush Foundation partnered with the Minnesota Council of Nonprofits to survey leaders. Chief executive officers (CEOs) and executive directors (EDs) were invited to participate in a demographic survey to supplement estimates of people serving as nonprofit leaders across Minnesota.
The survey of nonprofit leaders was open from November 14 - December 16, 2024. Of the 8,138 nonprofit leaders invited to complete the survey, 284 responded, for a response rate of 3.5%.
The nonprofit sector included respondents who identify as nonbinary, women, men, and individuals who opted to self-describe their gender identity. The government sector included respondents who identify as transgender, nonbinary, women, men, and individuals who opted to self-describe their gender identity. The business sector only included respondents who identify as women and men.
Fast facts
are leaders of color
People of color are underrepresented among Minnesota leaders across business, government, and nonprofit sectors.
leaders are women
While half of Minnesota's adults are women, just 29% of leaders across the state are women.
of government leaders are 65+
About 1 in 5 government leaders are older adults, compared to less than 1 in 10 business and nonprofit leaders.
Leadership resources
